
tl;dr I built a benchmark for Python Package managers, you can view it at https://lincolnloop.github.io/python-package-manager-shootout/
When starting a new Python project, you have a few different options for how you want to manage your dependencies. Like Node.js has npm, yarn, pnpm, and bun, Python has pdm, pip-tools, pipenv, and poetry (and others).
They largely do the same things and fans of each one will usually tout why their choice is better. It’s easy to compare tools based on features, but there isn’t any good way to see how they compare on performance. Slow tooling is a regular source of frustration for developers. How much time are you going to be waiting on packages to install either locally or in CI over the life of the project?
With this in mind, I set out to build an impartial benchmark for these projects.
A Real World Example
The first issue to tackle was finding a sufficiently complex real world set of packages to work against. The pain of slow tooling doesn’t really crop up until your dependency list is sufficiently large and resolving the dependency chain is non-trivial. I found a great sample from the folks at Sentry. Their product is largely open source and sufficiently complex that their requirements.txt made a great corpus to run the benchmark on. It is also interesting in that it includes at least one dependency that requires compilation instead of downloading a bunch of binary/pure-Python packages.
Operations to Benchmark
All these tools work slightly differently, but the general concepts are more-or-less identical. I decided to measure the following operations:
- Tooling installation: How long does it take to install the tool itself?
- Importing requirements: How long does it take to add all the depencencies to the project?
- Locking: How long does it take to generate a lock file (resolve dependency chain, pin all the dependencies, and fetch published hashes for the packages)?
- Install: How long does it take (with both a cold and warm cache) to install all the dependencies?
- Update: How long does it take to update all the dependencies?
- Add Package: How long does it take to add a new package to the list of dependencies (including install & re-lock)?
Lies, Damned Lies, and Benchmarks
Whenever you publish a benchmark, people will come out of the woodwork to tell you all the ways it is incorrect. I knew I needed to build something that was repeatable and auditable. I hoped package manager maintainers would contribute to the repo to ensure their projects are represented fairly (which they already have!). I also want people to be able to easily add new tools to the benchmark. With that in mind, here’s where I ended up…
GitHub Actions
Publishing the code used to perform the benchmark was a given, but I wanted to take it a step further. I’m lazy and don’t want to have to re-run the benchmark every time somebody makes a change or releases a new version of a package manager. I also don’t want to update the site with the results manually. So I automated the entire thing.
GitHub Actions provides everything I needed for the automation. It can re-run the benchmarks on a schedule, then parse the results and update the site (published on GitHub Pages). Since these run on shared hardware and depend on external network resources, there is variability in the results. To combat that, we publish the average results of a few runs.
Structuring the Benchmarks
I wanted the GitHub workflow file to be machine generated to make it easy to add new tools without an error-prone copy/paste/replace process. I needed some way to abstract the unique commands of each tool into a shared set of commands that could easily be templated. The tool everyone loves to hate, make, fit the bill perfectly. Our Makefile provides a lightweight abstraction layer over all the differences. With that in place, I could use a generic template and assemble the workflow file using a simple bash script with envsubst.
Timing
The time command (not the built-in shell function) has everything needed to measure the performance of the individual commands. Wrapping them in make may create the tiniest bit of overhead, but I suspect it is so small it gets rounded off. time lets you output to a file in whatever format you want. I made it output as a CSV and collect all the operations into a single file for each package manager.
Aggregation
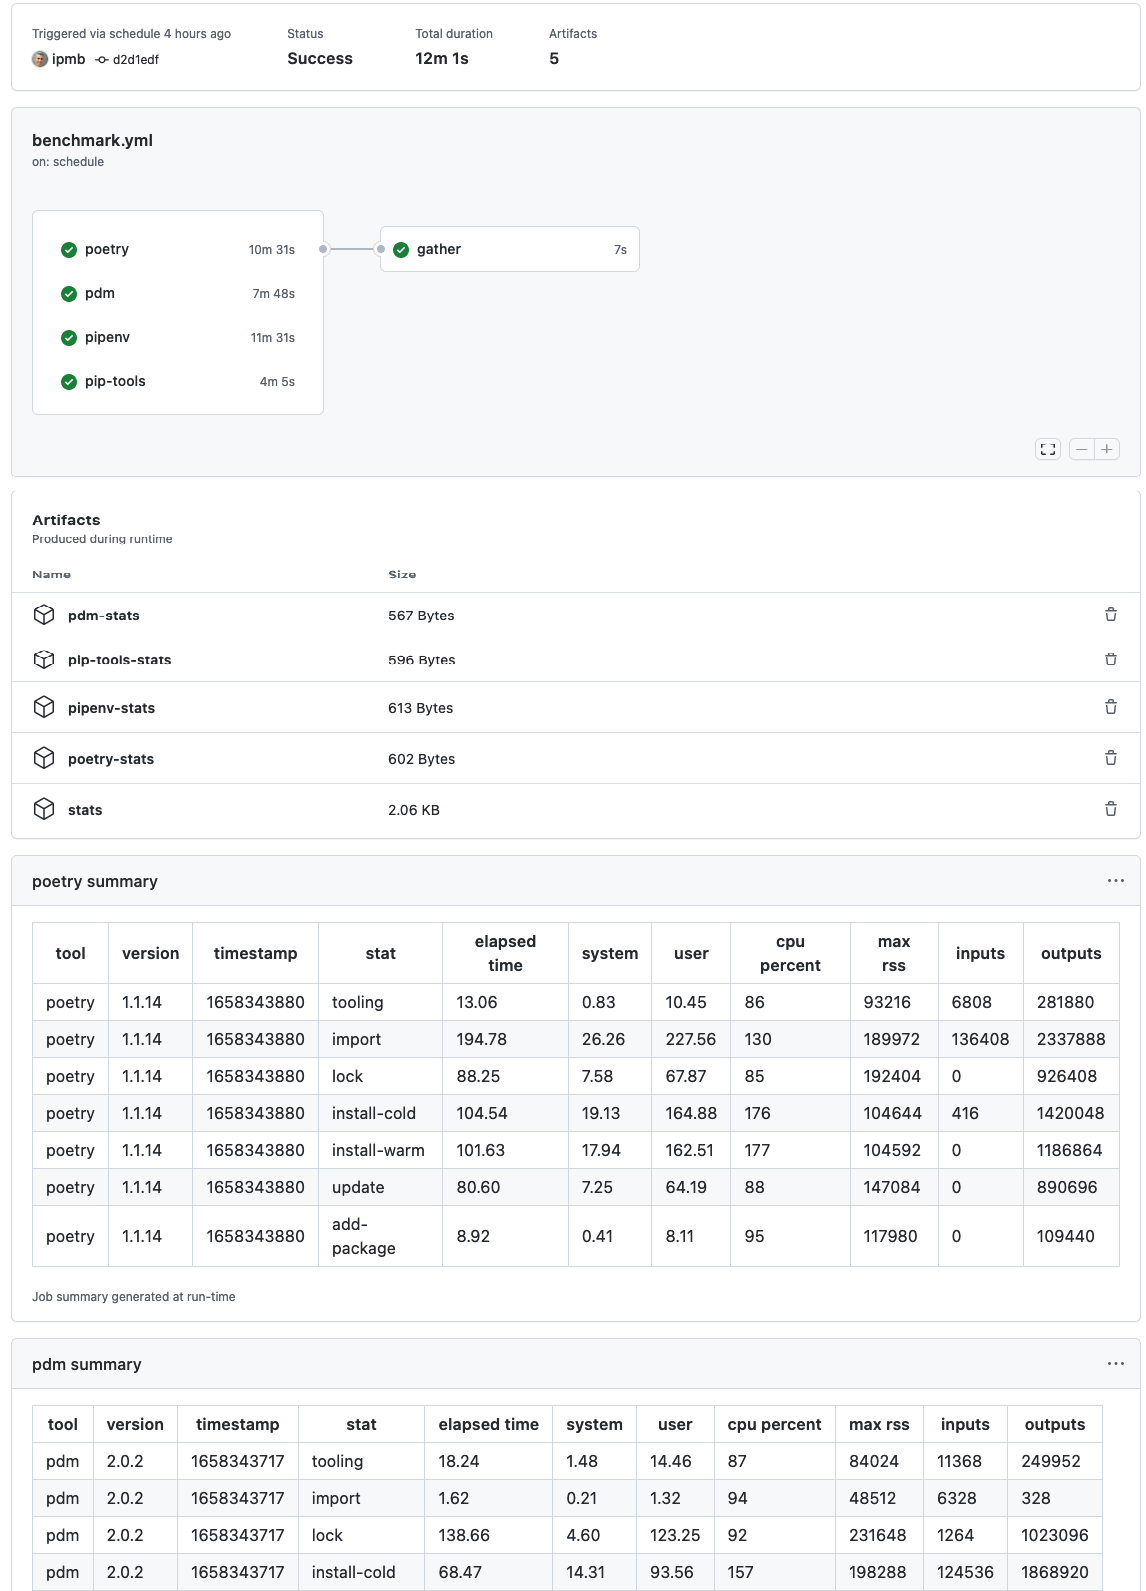
Each tools benchmark runs as a separate job in parallel on GitHub Action. When each job completes, it uploads its result CSV as an artifact. When all the jobs complete, we run a final job which gathers and combines the CSVs into a single file (thanks sqlite-utils!) and stores it as a new artifact.
I leveraged the newer job summary functionality along with mdtable to show a pretty representation of the CSVs in the GitHub Actions web interface which has been invaluable for debugging.
Building the Site
Once the benchmarks finish, a new workflow is kicked off to rebuild the site with the new data. This involves:
- Downloading the aggregated data
- Transforming the data in Python into the format expected by Chart.js
- Building the static site with
parcel - Generating an open graph image with
shot-scraperso we get a pretty (and accurate) graph preview when the link is shared. - Pushing the files to
gh-pagesand letting it get deployed via GitHub Pages
Wrapping Up
So far this all seems to plug together quite well. Is it overengineered? Probably a bit 😄 That being said, I’m happy with the results. It’s fully auditable and I don’t have to answer questions about my laptop and internet connection and the position of the moon when the tests were run. It doesn’t require maintaining any infrastructure and uses a lot of basic Linux constructs which will still work years from now. The external dependencies are minimal, so I don’t anticipate it requiring much maintenance.
Interpreting the Results
All these package managers are the result of thousands of hours volunteered by folks in the Python community. Please don’t use these results to shame or disparage the projects or their maintainers… there’s too much toxicity out there already. My intent with publishing these is that people who are evaluating package managers have access to unbiased performance info. I also hope maintainers find it useful to identify places where these tools have room for improvement (it has already caught one major regression!). A faster Python ecosystem is better for everyone.
If you have suggestions on how to improve this benchmark, please don’t hesitate to create an Issue or submit a pull request.
Photo by Pascal Swier on Unsplash