Part 1 | “Part 2”/blog/2011/oct/12/load-testing-jmeter-part-2-headless-testing-and-je/ | Part 3
Last week, Yann Malet and I gave a talk at DjangoCon about using performance analysis to spot bottlenecks in your application. Because of the somewhat broad scope of the talk, we were only able to briefly introduce the tools we use and how we use them. Over the next several weeks, we plan to dive a little deeper into some of those tools here on our blog.
To start off, I’m going to go over our JMeter setup in much more detail. It is a very powerful tool capable of complex load tests, but it is very unfriendly to new users and the documentation is not ideal. I’ll go over the basics and cover a couple of tricky things like how to authenticate, and simulating Ajax requests. This information is presented with Django in mind, but should apply to any framework you’re working with.
Load Testing
Load testing focuses on simulating and often exceeding your expected production load, throwing many concurrent requests at your site for an extended period of time. The key to load testing is realism. You need to know your application and your audience well, so that you can balance your load across your application in a way that closely mimics your actual or expected production traffic.
While your load test is executing, you have the opportunity to monitor your entire server stack and see what happens over time as your application handles the load. As time progresses, the load should shift. This could be because more pages are being cached, or more keys are being invalidated. Your application servers may be waiting on external services, or you could see swapping increase as your servers run out of physical memory. Load tests give you the opportunity to see how your site will perform when the going gets tough.
Installing JMeter
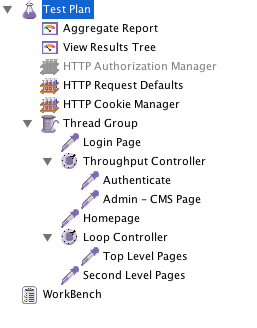
JMeter provides a GUI for test building, allowing you to create various elements in a tree to craft complex load tests that handle a wide variety of different scenarios.
Installation is typically quite easy. On Ubuntu, you can install it with apt-get.
$ sudo apt-get install jmeter
$ brew install jmeter
Fire it up!
JMeter load tests are simply XML files, so you can check them in to your version control system without worrying about binary data. We typically create a jmeter folder in our project, and create the plan there. One important thing we add to this folder is a user.properties file. This allows us to configure some aspects of JMeter that are not available to us through the GUI. Typically, our user.properties file looks like this:
CookieManager.delete_null_cookies=false
CookieManager.save.cookies=true
jmeter.save.saveservice.url=true
jmeter.save.saveservice.requestHeaders=true
CookieManager options make sure that cookies with null values are preserved, and that cookies are saved to local variables that can be referenced from within JMeter test plans. The saveservice options make sure that urls and request headers are saved to the log file when running JMeter headless, which we do from Jenkins.
To start JMeter, cd__ to your test plan folder and simply run _jmeter. The user.properties file should be automatically picked up because it is in the working directory when JMeter is launched. One of our developers who works in Ubuntu, however, reports that he has to pass the properties file explicitly by using jmeter -p user.properties. Keep that in mind if you have trouble with things like authentication.
Configuration
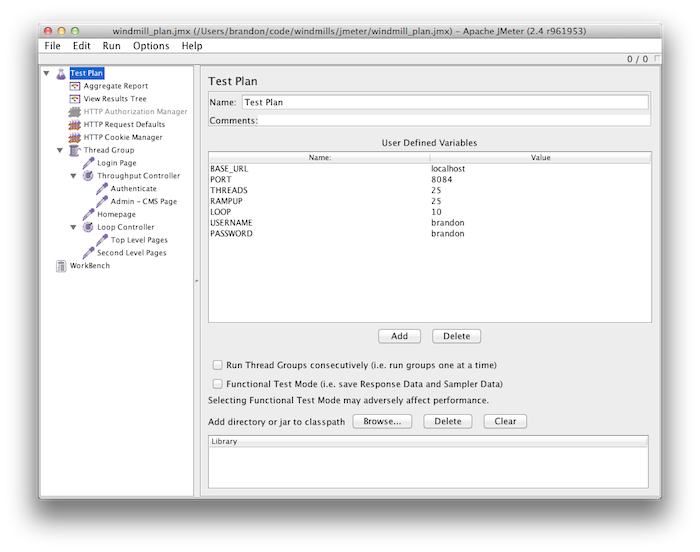
In order to make the configuration of our test plans easy to change, we set a number of user defined variables directly on the root “Test Plan” element.
We do this so that we don’t have to go hunting in child elements to update these often-changed attributes. The THREADS setting determines how many virtual users will be accessing your site at the same time. This is similar to the ‘concurrency’ option on the popular ab (Apache Bench) tool.
RAMPUP is a setting that allows you to slowly work your way up to the number of THREADS. This way, your site is not immediately slammed by a large number of simultaneous connections all hitting the same url, which is mostly unrealistic. The threads that began at the beginning of your test plan will have already progressed to some of the other urls by the time new threads spin up, so it distributes the requests more evenly across your application.
LOOP is the number of times each thread will loop through the test plan. For example, if you have 50 threads and a loop value of 10, your plan will be executed 500 times. This is important for sustained load tests – you want your test to run long enough for you to spot issues with things like cache invalidation or key eviction.
We include these settings in our test plan elements with Java string substitution: ${my_variable_name}. The dollar sign and curly braces tell JMeter that it needs to read a variable or execute a function.
Generating Requests with Samplers
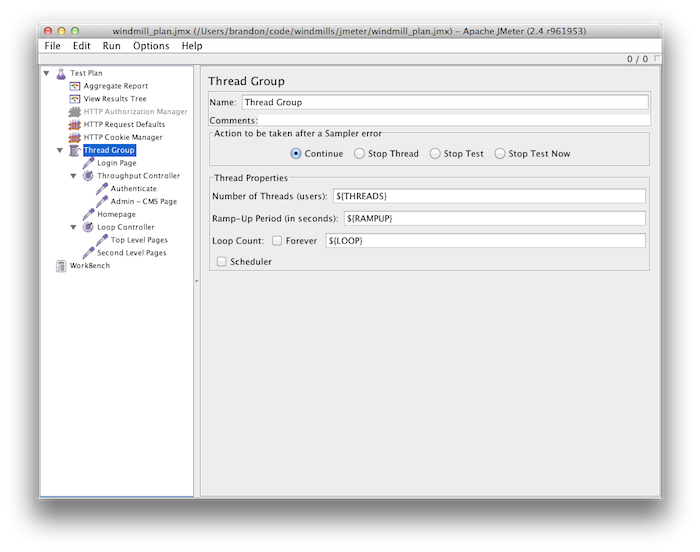
The first thing you’ll want to create in your test plan is a Thread Group. Right-click on the “Test Plan” element, select “Add”, then “Threads (Users)”, then select “Thread Group”. Once the element is created, fill in the “Thread Properties” with your settings variables from the “Test Plan” element.
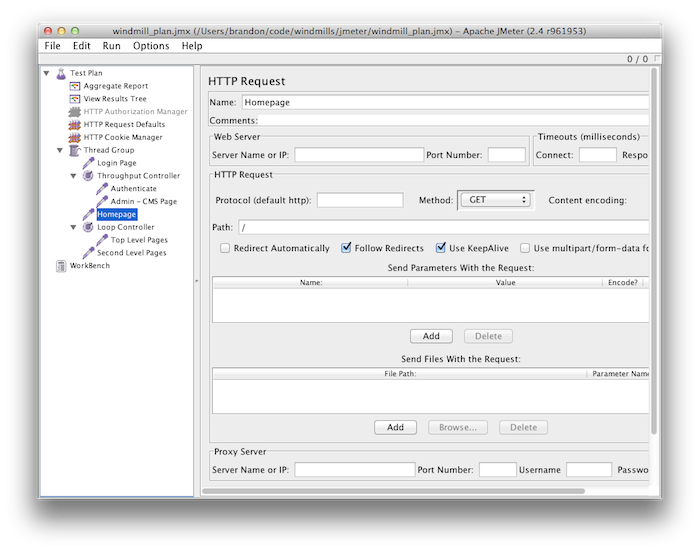
Next, right-click the thread group and select “Add → Sampler → HTTP Request”. The sampler element will be created, and you will be presented with a rather large variety of ways to customize your request. The only thing you need to pay attention to at the moment is “Server Name or IP” and “Path”.
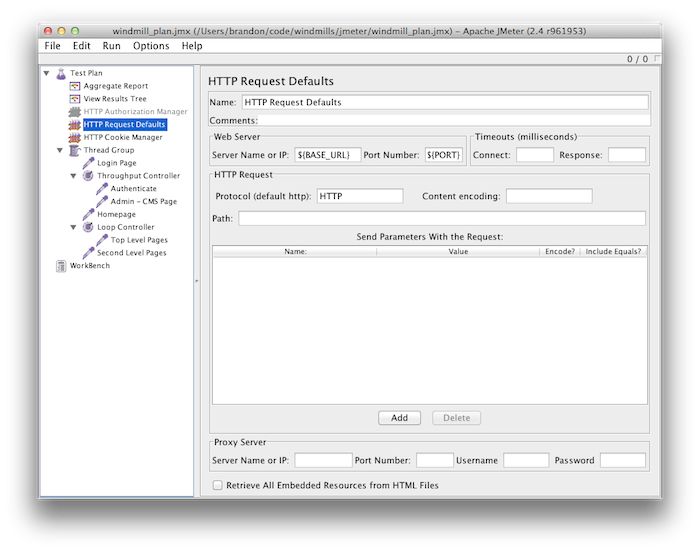
Right away, you’ll likely realize that entering the server name and port on every single sampler could be repetetive. JMeter provides an easy way to manage this with the “HTTP Request Defaults” Config Element. Right-click on your “Test Plan” element, and select “Add → Config Element → HTTP Request Defaults”. There, you can enter your domain, port, and any other detail you want to apply to all “HTTP Request” samplers within the same scope.
At this point, you can go ahead and run your load test. On Mac, the keyboard shortcut is Cmd+R, and and most other platforms it is Ctrl+R. You can stop your test plan by pressing Cmd+. or Ctrl+..
Gathering Data with Listeners
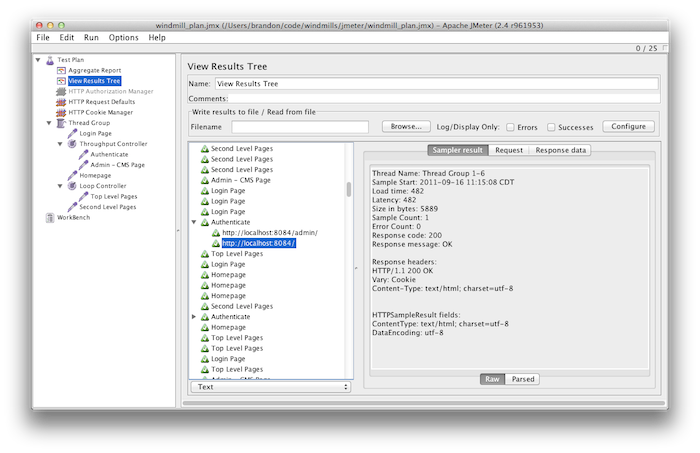
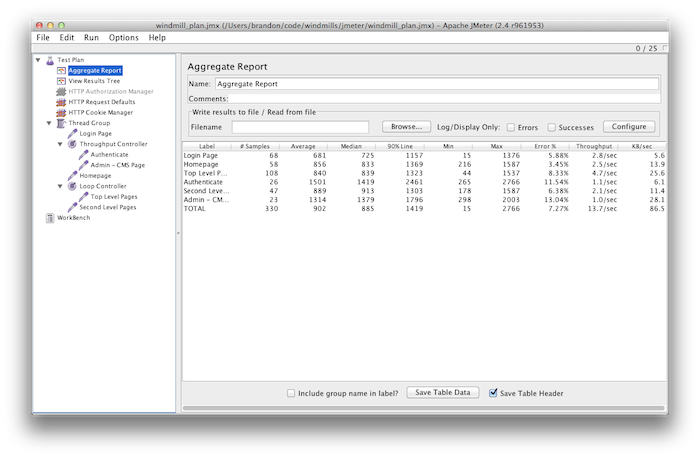
So your test can now make a request, but you won’t actually get any visible data back from it until you add a Listener. Two of the most useful Listeners are “Aggregate Report” and “View Results Tree”.
The results tree will give you the details of each request that JMeter generated. This is useful for tracking down errors in your plan, or in your application.
The Aggregate Report gives you rolled up statistics, separated by sampler and then totalled at the bottom.
Retrieving Data from a Text File
JMeter provides access to a variety of functions within your test plans. One particularly useful function is StringFromFile(). This allows you to grab data from a text file separated by newlines. The path of the file is relative to where you launched JMeter, so we keep our data in a data subdirectory within our jmeter folder.
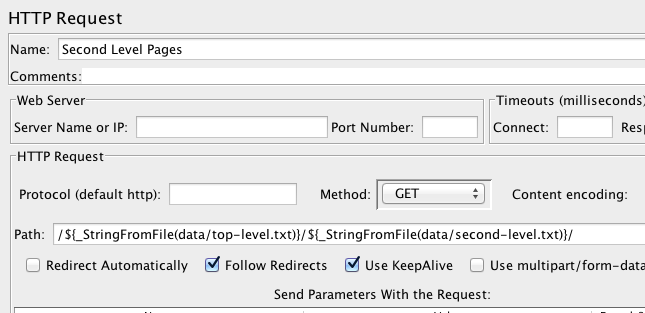
One of the ways we use this is to dynamically construct urls. This allows you to use one sampler per section for your site, and just include data like slugs from text files for your threads to cycle through. Each time JMeter encounters the StringFromFile() method for a particular file, it will read the next line in the file.
For example, if you had a url of /articles/my-article-slug/, you could keep a collection of slugs in a text file to use for that component of the url. The text file should look like this:
a-very-interesting-article
an-even-better-article
not-quite-as-good-but-still-fascinating
this-is-the-last-one-i-swear/articles/${_StringFromFile(data/my-text-file.txt)}/ and each time a thread comes to that sampler it will select the next slug in the list.
With this technique, you can create very clean test plans that don’t have to have an individual sampler for every single unique url value you want to test.
Logging In
Authentication in JMeter was a challenge at first. Django’s CSRF protection introduced some complexity which I initially addressed by adding a post-processor that used a regular expression to find the CSRF div. The post-processor would add the value of the div to a variable, which I then used in the subsequent HTTP Request. I later found this to be completely unnecessary, however, when I discovered that I could access cookies in JMeter using variables.
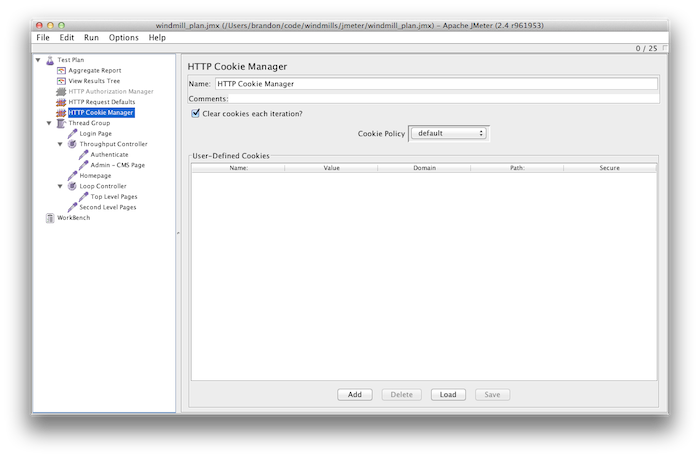
The CookieManager.save.cookies=true property works along with the “HTTP Cookie Manager” Config Element to save cookies as variables, which can be referenced like this: ${COOKIE_cookiename}
With the “Clear cookies each iteration” option set, at the end of each test loop the current thread will clear the cookies – giving each test loop a clean slate to work with.
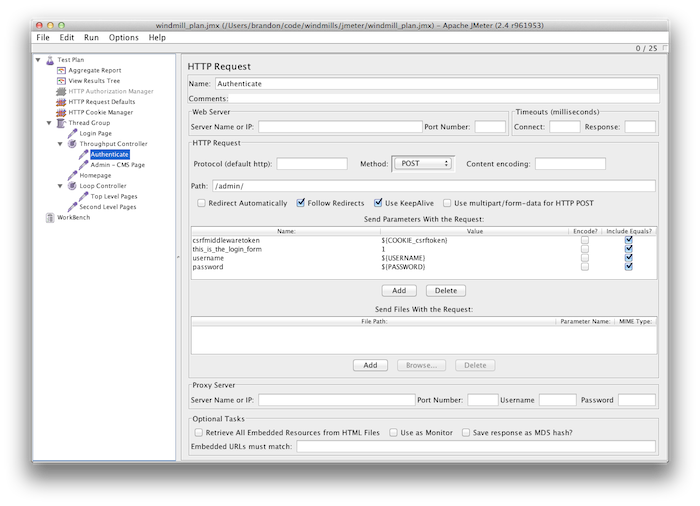
To handle authentication, you can simply create an “HTTP Request” that uses the POST method.
In this example, I’m using Django’s admin login form. I’ve changed the “Method” dropdown to POST, and I’ve added some parameters to send along as POST data.
The first parameter is the CSRF token. To reference it, I use ${COOKIE_csrftoken}. This cookie is automatically added by the CSRF Middleware. Next, I add a parameter that is unique to the admin login form – “this_is_the_login_form”. This is required in order to make admin logins work. Finally, I finish up by adding the username and password, taken from the values set in the root “Test Plan” element.
Once the thread logs in with this form, all subsequent requests made by this thread will remain logged in, until the loop is done and the cookies are cleared.
It’s a very good idea to test your site with authenticated users, and make sure to include some admin activity as well. You need to know how your site is affected when your admin team is adding or changing content to the site, because this will often trigger cache invalidation or large querysets. We’ve occasionally had to tweak our admin change views because the default querysets taxed the database too heavily.
Ajax Requests
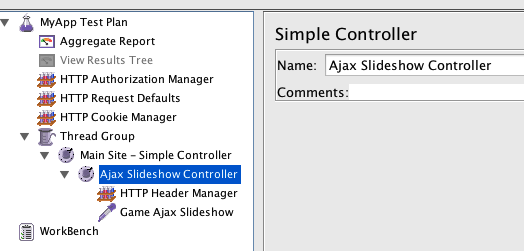
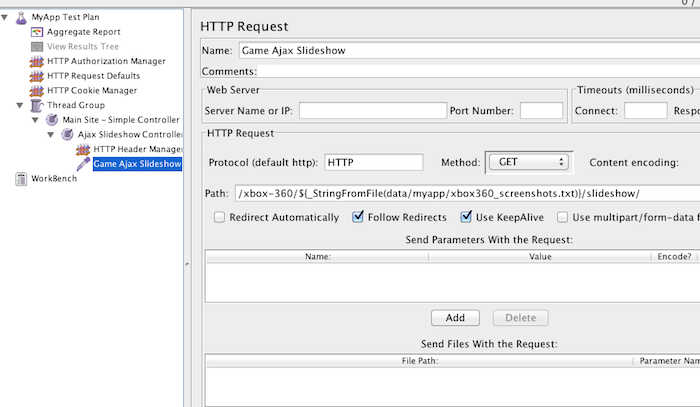
Simulating Ajax requests with JMeter is another tricky process. The best way I’ve found to do it is to add a simple “Logic Controller”, so that you can add an “HTTP Header Manager” Config Element and limit the scope to one particular sampler. The header manager will allow you to add the “X-Requested-With” header to your request, signaling to your application that this is an Ajax request.
First, add a “Simple Controller” by right-clicking your thread group, and selecting “Add → Logic Controller → Simple Controller”.
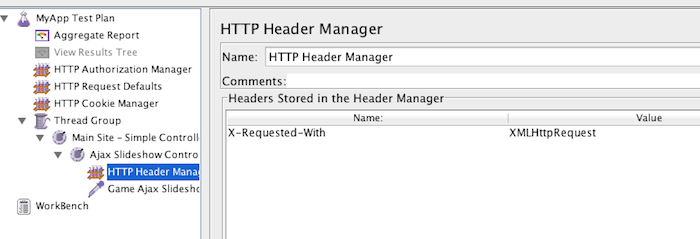
This allows you to control the scope of the “HTTP Header Manager”‘s effects. Next, right-click your simple controller, and select “Add → Config Element → HTTP Header Manager”. Create a header called “X-Requested-With”, with a value of “XMLHttpRequest”.
Finally, create your “HTTP Request” with whatever details you need.
This is a simple GET request, but you can change the method to POST and add whatever parameters you need there.
Bombs Away!
You should now be able to create a detailed performance test for your application, with the power to significantly bog down your servers and see where the problems are in your infrastructure. You will typically want to run this kind of test targeting your staging environment, or if your application isn’t yet public you can aim it at your soon-to-be production setup. However, load testing from your local machine can be somewhat limiting because of bandwidth constraints.
My next post will demonstrate how to run JMeter from the command line in headless mode, and show how to plug it into Jenkins using the Performance plugin. Until then, enjoy slamming your servers with as much bandwidth as your local machine can wrangle!


