Case Study
Data visualization platform for the Big Cities Health Coalition
When Drexel University's Urban Health Collaborative needed to make a large, complex public health dataset usable for policymakers, researchers, and the public, Lincoln Loop built the Big Cities Health Inventory Data Platform, a durable web application that translates population health data across 35 major U.S. cities into clear, explorable visualizations.
Background
The Big Cities Health Coalition brings together public health officials from 35 of the country's largest cities, representing roughly 20 percent of the U.S. population. Drexel's Urban Health Collaborative had assembled a rich dataset spanning indicators like HIV rates, COVID-19 outcomes, chronic disease, life expectancy, and racial and ethnic health disparities. The data existed, but it wasn't accessible. Turning it into something useful required more than a chart library.
Challenge
The project combined several layers of complexity.
The dataset itself was large and evolving, with definitions, relationships, and metrics that required careful interpretation before any technical decisions could be made. Beyond understanding the data, the platform needed to:
- Handle large, infrequent dataset updates without downtime or data loss
- Support accurate data updates by non-developers
- Present complex, stratified data clearly across a wide range of users and use cases
There was also a natural gap between domains. Drexel's team brought deep expertise in public health. Our role was to translate that expertise into a system that could be maintained and extended over time.
Client


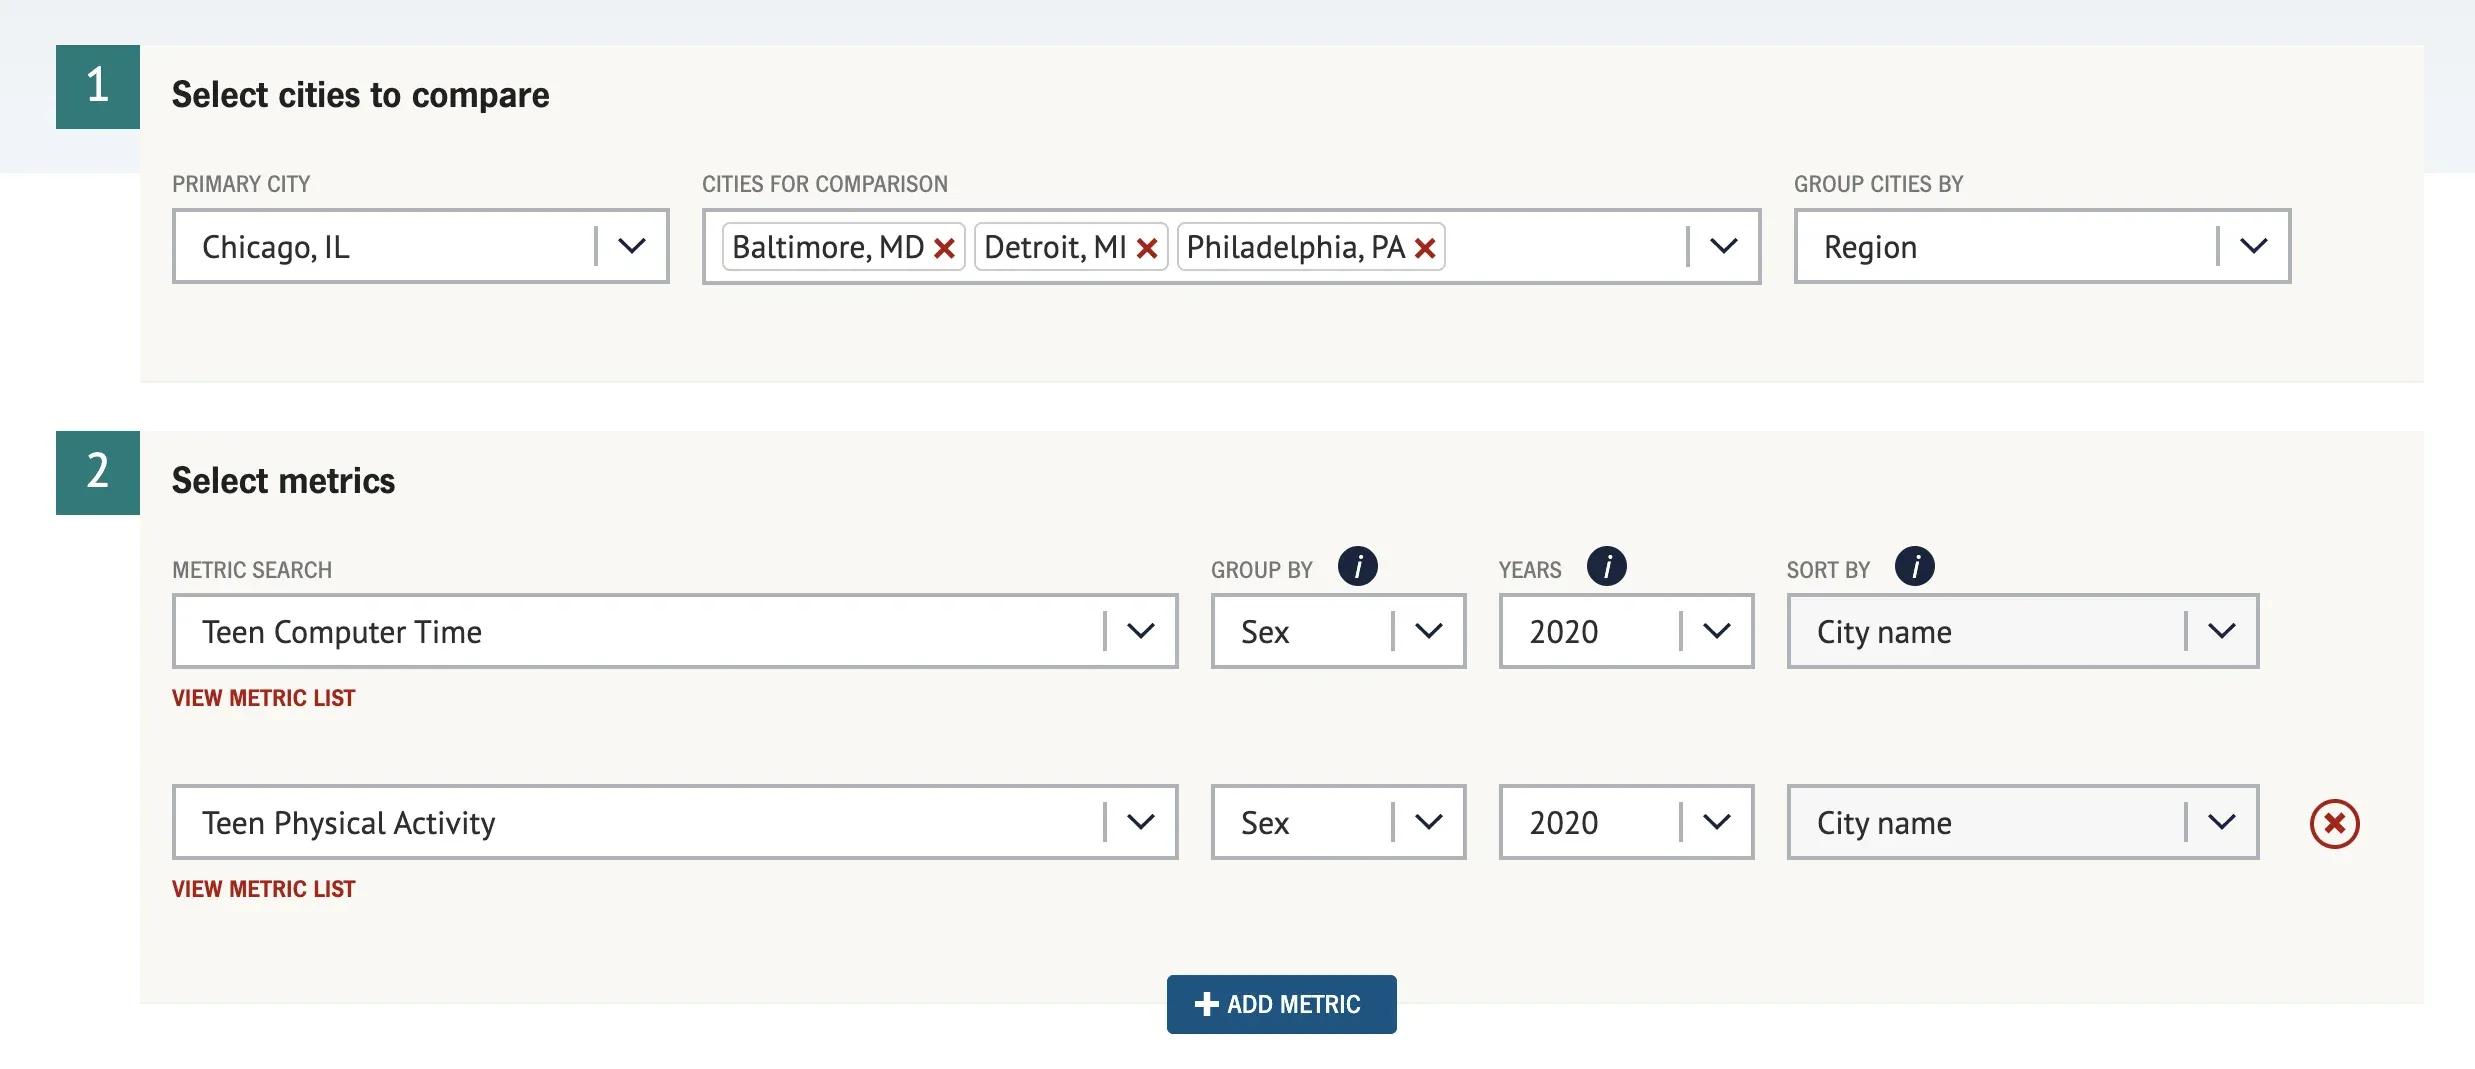
The filter interface puts city selection, metric search, and stratification controls within reach of any user, no technical background required.
Solution
Understanding the Data
We began by working closely with Drexel to understand the structure and meaning of the dataset. That groundwork shaped everything from database design to filtering logic. We favored a data model that reflected the domain directly, one that could be managed without specialized knowledge.
Reliable Data Ingestion
We implemented a straightforward import process through the Django admin. Uploads are processed asynchronously with clear user feedback, keeping the system simple to operate without sacrificing reliability. Non-developers can manage updates without fragile scripts or operational overhead.
Designing for Exploration
The platform supports three primary ways of exploring the data:
- Single city view: explore all metrics for one city in depth
- City comparison: compare metrics across multiple cities side by side
- Metric explorer: examine a single indicator across all cities
Each view is backed by a consistent set of filters and a REST API. We used Vue.js to manage state and Highcharts to render visualizations, a combination that produced a responsive, maintainable interface.
Visualization Rules
Presenting stratified public health data clearly required deliberate decisions. Default chart behavior often produces misleading results on complex datasets. We introduced rules refined through iteration with the Drexel team:
- Time series data renders differently depending on whether one city or many are selected
- Charts are constrained when too many data points would reduce readability
- Stratified data is split into multiple charts when necessary to preserve clarity
- Color, spacing, and typography adjust dynamically based on context
The Right Fit for the Job
This project required a team comfortable working across data modeling, user experience, and long-term maintainability. Django provided a stable foundation for managing complex datasets and administrative workflows. Vue.js allowed us to build a responsive frontend without unnecessary complexity. Just as important, we worked closely with Drexel's domain experts throughout to ensure the system reflected how the data is actually used, from the data model to the visualization rules.
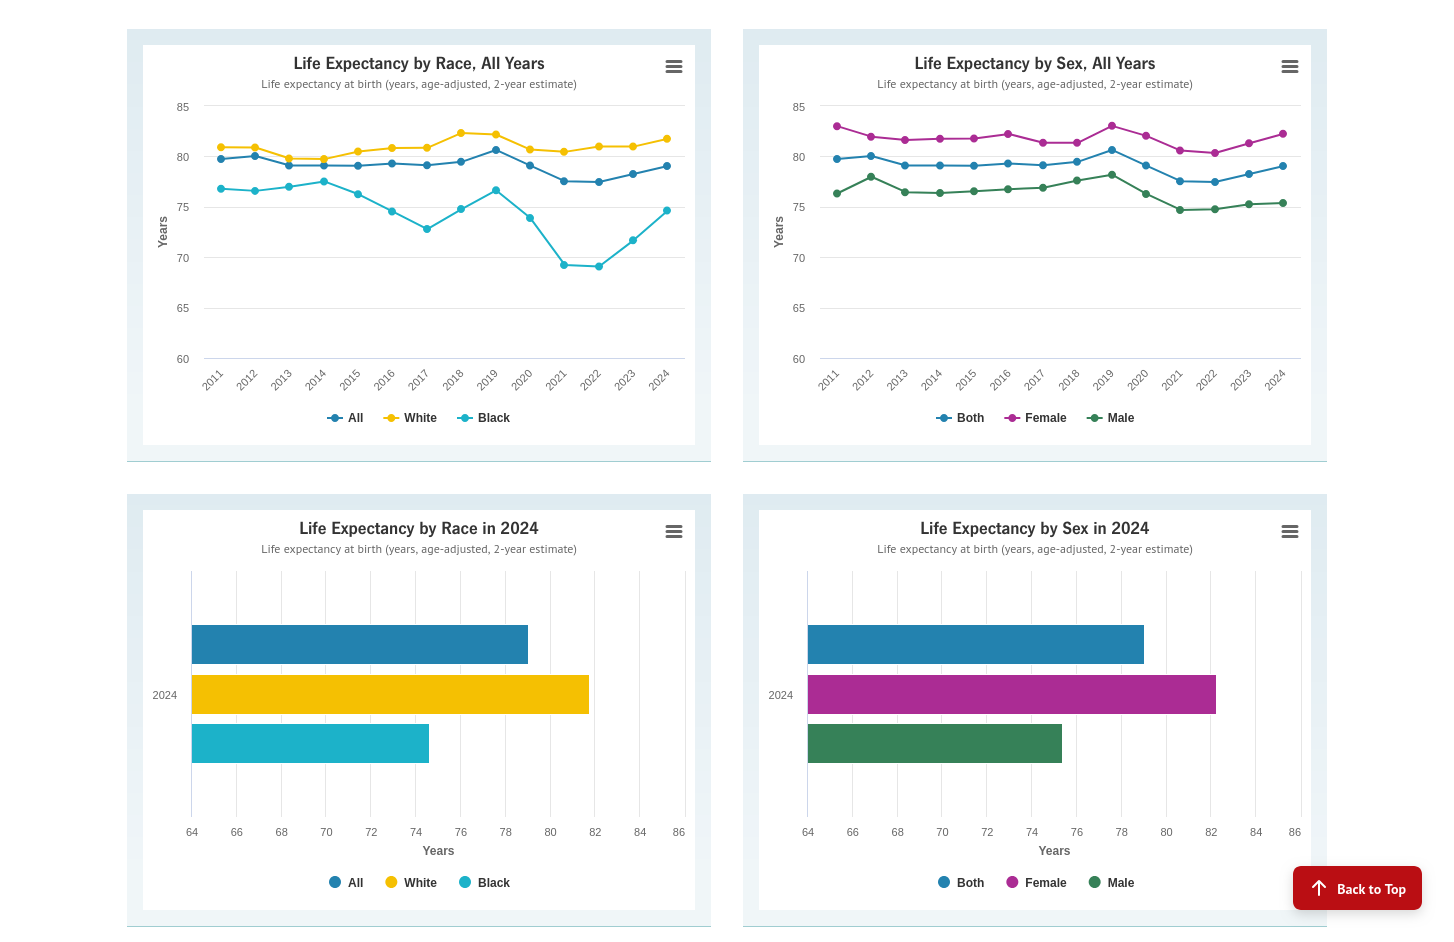
Stratified metrics are automatically split into multiple views, with chart type, color, and layout adjusted to keep complex data readable rather than overwhelming.
Result
The Big Cities Health Inventory Data Platform is used by policymakers, researchers, and public health professionals to understand health trends and disparities across U.S. cities. The platform was delivered on time and within budget. It continues to operate with minimal maintenance, allowing the Drexel team to focus on the data rather than the infrastructure beneath it.
Looking Forward
- Expanding the platform as new health metrics and city-level datasets become available.
- Making it easier for health departments to reuse and share data through dashboards, reports, and embedded visualizations.
- Continuing to provide a stable, maintainable foundation that can support years of public health research, benchmarking, and policy decision-making.
125
Metrics
~250K
Records
35
Cities
Lincoln Loop expertly turned our ideas into a beautiful, customizable, user-friendly site that our team and users love. With each sprint, they've delivered exceptional quality work on or ahead of schedule. It has been an absolute joy working with them!
Let’s build something great
 Our work has helped over 1 billion people,
delivering solutions that make a difference.
![]() 15+ years of working together,
15+ years of working together,
expertise you can rely on
— no revolving doors.

5 STAR CLIENT REVIEWS
in the fields of friendliness, communication, and knowledge.