The Preparation
Before anything else, preparation is the key to success.
—Alexander Graham Bell
With your Django site deployed to live servers, you’ll probably either be excited to show the world your project or terrified it will fall flat on its face when the barrage of real world traffic hits. If you’re in the excited camp, you need to cool your jets, there’s still more work to do. If you’re terrified, let’s take some steps to quell your fear.
Up to now, we’ve made educated guesses at where the hot spots will be in your application. But educated guesses can only take you so far. It’s time to load test the system and collect real data to know if, and where, further optimization is required. Starting this process early in your development cycle will save you time by showing you exactly where optimization is needed, and when you’ve reached “good enough”.
Load Testing with Jmeter
There are a number of tools available that let you generate a flood of HTTP
traffic to see where and when your servers start to topple over. Apache
Bench (ab)[1] and Siege[2] are popular and easy to use tools for
basic sanity checking, but for more robust tests, Jmeter is king.
Jmeter is one of those Java apps you love to hate. It’s really powerful, but comes with a steep learning curve and a nonintuitive interface. It can be configured and run via a GUI or from the command line with an XML configuration file.
We typically build out a test plan in the GUI, then export it to XML for
automated headless testing. To get started, you’ll want to create a
user.properties file with the following values:
CookieManager.delete_null_cookies=false
CookieManager.save.cookies=true
jmeter.save.saveservice.url=true
jmeter.save.saveservice.requestHeaders=true
These values ensure we have what we need to successfully authenticate against
a Django site and also log some additional information that may come in handy
later. Jmeter will pick up these settings when started with
jmeter -p /path/to/user.properties.
Tip
You’ll need to create a few more files along the way. On our projects
we often put a jmeter folder in the root of the repository to store the
files and share the test plans amongst developers. Test plans can be saved
to a .jmx file from the File menu in the GUI.
Configuration
First, set a few user defined variables directly on the root Test Plan element:
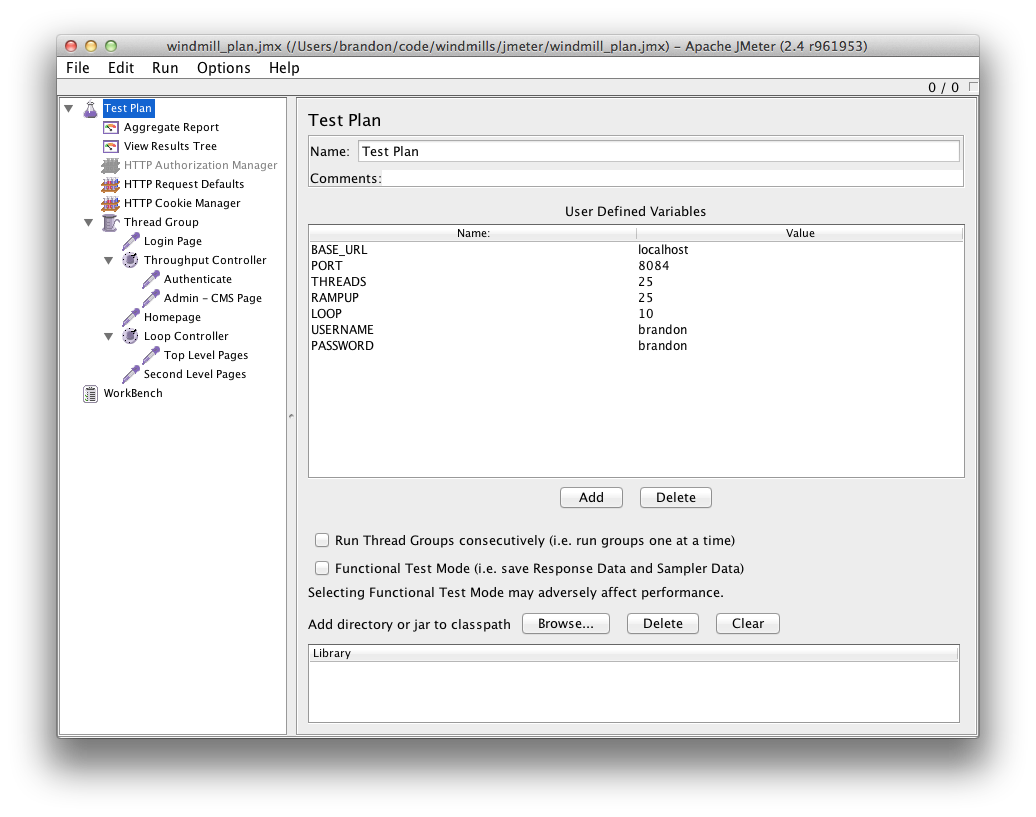
This keeps things DRY, making it easy to change
the values globally rather than hunting across child elements. The THREADS
setting determines how many virtual users will be accessing your site at the
same time. This is similar to the concurrency option in ab.
RAMPUP allows you to slowly work your way up to the number of THREADS.
By avoiding immediately hitting the same URL with a large number of
simultaneous connections, your tests will be more realistic.
LOOP is the number of times each thread will loop through the test plan. For
example, if you have 50 threads and a loop value of 10, your plan will be
executed 500 times. It is important for your test to run long enough to spot
issues with things like cache invalidation or key eviction.
These settings can be included in test plan elements using Java string
substitution: ${my_variable_name}. This tells JMeter to read a variable or
execute a function.
Generating Requests with Samplers
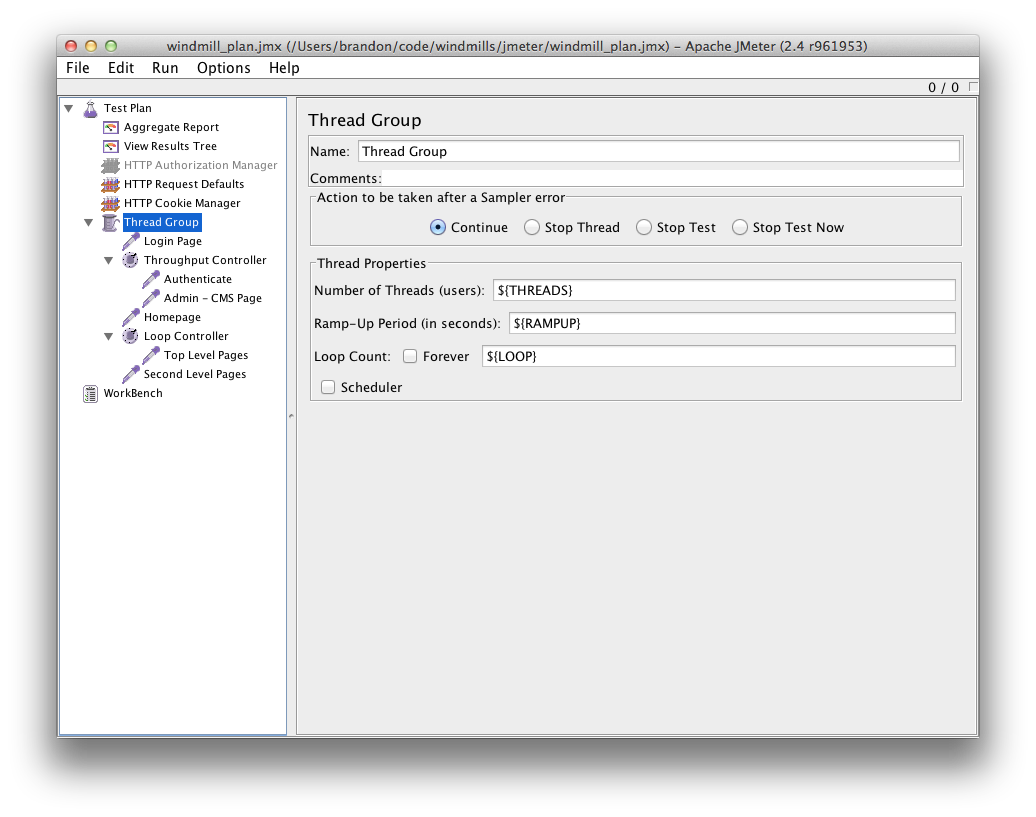
First create a Thread Group by right-clicking on the Test Plan element, then selecting . Once the element is created, fill in the “Thread Properties” with your settings variables from the Test Plan element.
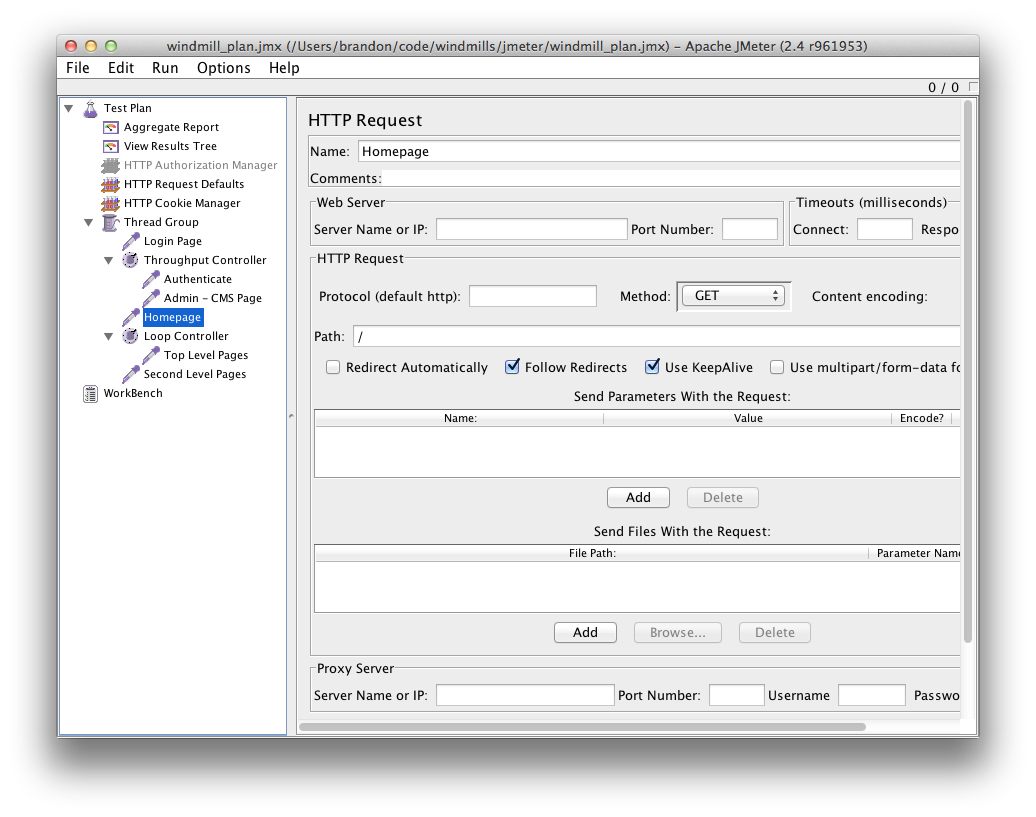
Next, right-click the thread group and select to create a sampler element. You’ll see there are lots of ways to customize your request. The most important ones to get started are “Server Name or IP” and “Path”.
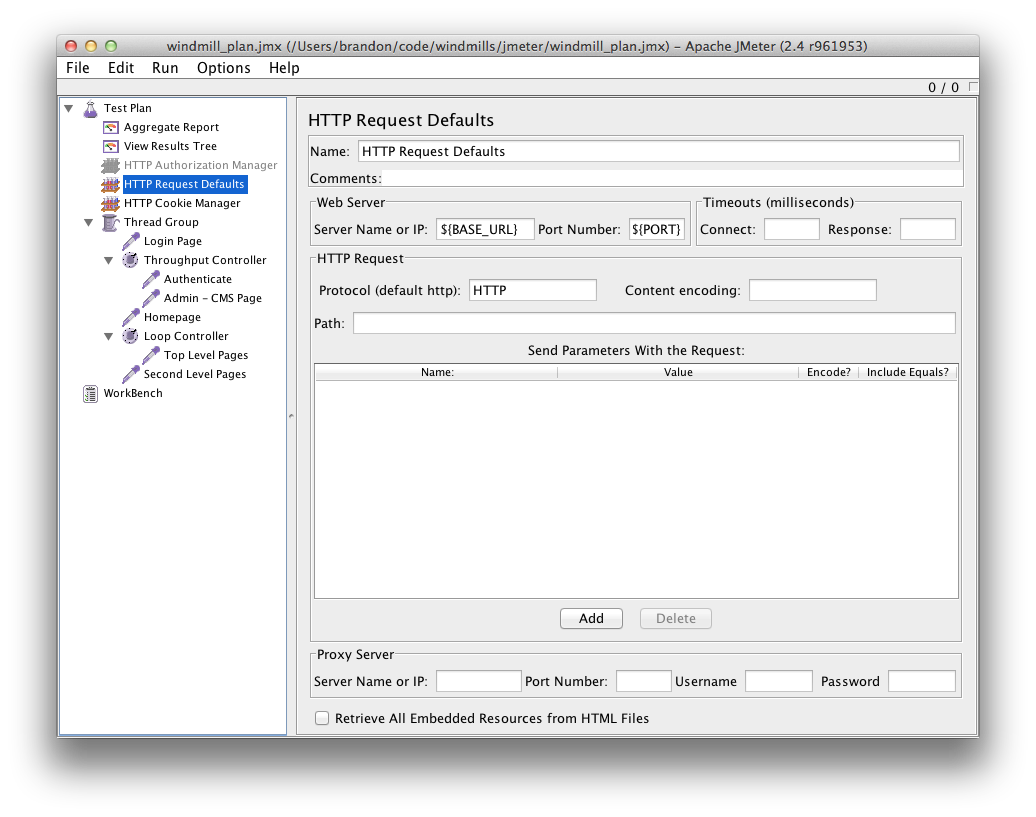
JMeter provides an easy way to manage these globally with the “HTTP Request Defaults” config element. Right-click on your Test Plan element, and select . There, you can enter your domain, port, and any other detail you want to apply to all “HTTP Request” samplers within the same scope.
At this point, you can run the Test Plan. Use Control-R to start it and stop it with Control-+. On OS X, use Command instead of Control.
Gathering Data with Listeners
To collect useful data from the tests, add a Listener to your Test Plan. Two of the most useful Listeners are Aggregate Report and View Results Tree.
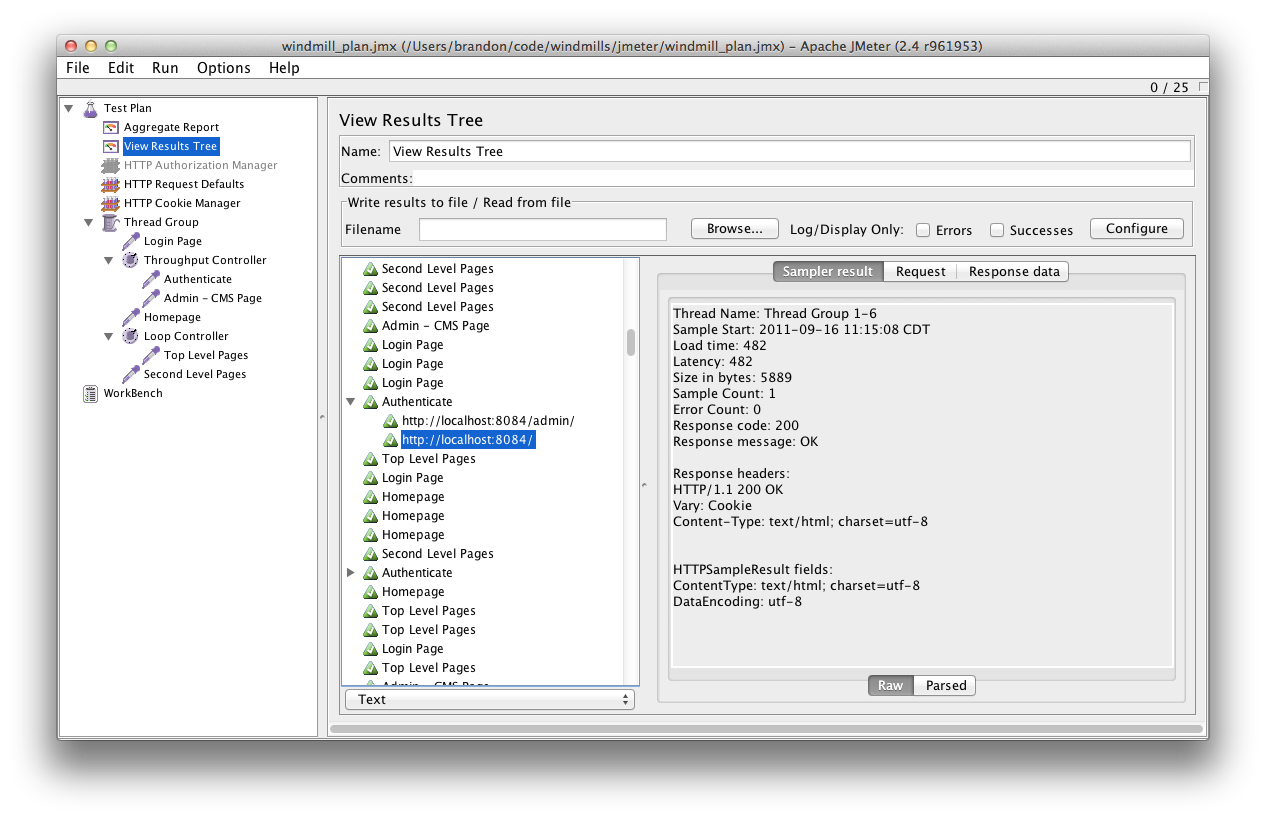
The Results Tree provides details of each request JMeter generates. It is useful for tracking down errors in your plan or application.
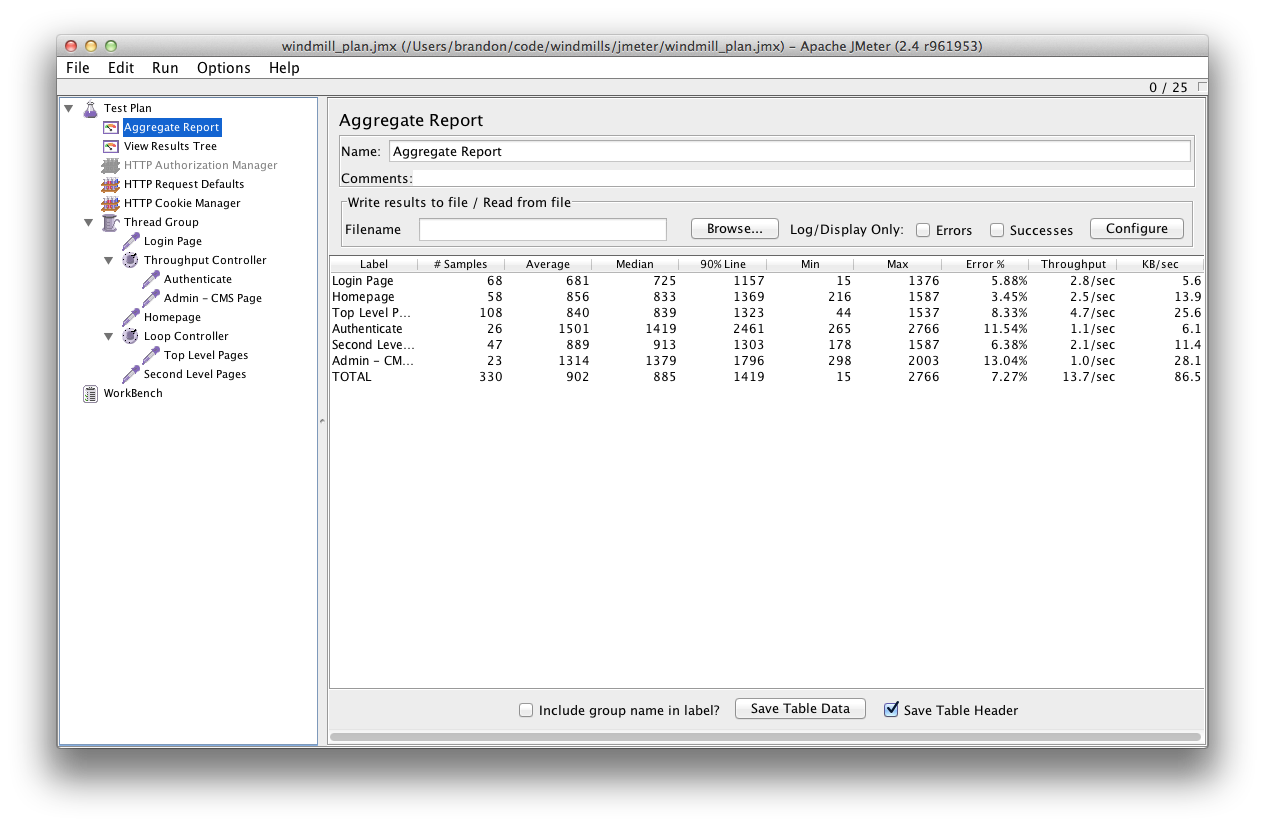
The Aggregate Report gives you rolled up statistics, separated by sampler with a total at the bottom.
Retrieving Data from a Text File
JMeter provides access to a variety of functions within your test plans. One
particularly useful function is StringFromFile(). It retrieves data from a
text file separated by newlines. The path of the file is relative to where you
launched JMeter, so we keep our data in a data subdirectory within the
jmeter folder we created earlier.
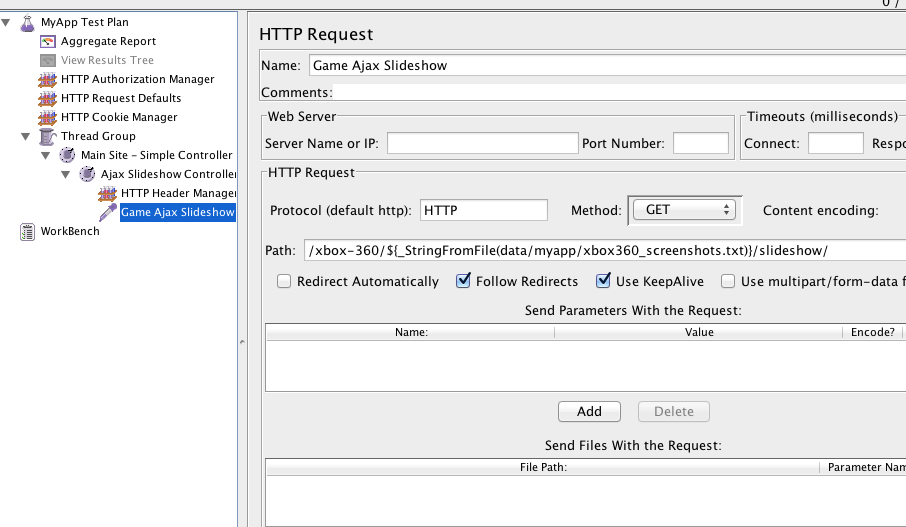
This is great for dynamically constructing URLs. Each time JMeter encounters
the StringFromFile() function for a particular file, it will read the next
line in the file.
For example, if you had a URL in the form of /articles/my-article-slug/,
you could keep a collection of slugs in a text file like this:
a-very-interesting-article
an-even-better-article
not-quite-as-good-but-still-fascinating
this-is-the-last-one-i-swear
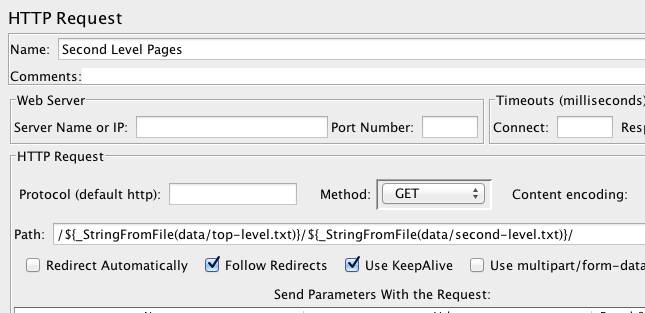
Then, in the HTTP Sampler, refer to the path as
/articles/${_StringFromFile(data/my-text-file.txt)}/ to cycle through each
article slug in the list.
This technique makes it easy to use an individual sampler for testing multiple pages on your site.
Tip
If you are replacing an existing site and have access to Apache style traffic logs, you can feed them directly into JMeter to replay the traffic against your new site. We have a write-up on our blog[3] with more details.
Logging In
Django’s CSRF protection makes authentication with JMeter slightly more
challenging. This is where the CookieManager.save.cookies=true property
comes in handy. The HTTP Cookie Manager config element saves
cookies as variables, which can be referenced as ${COOKIE_cookiename}.
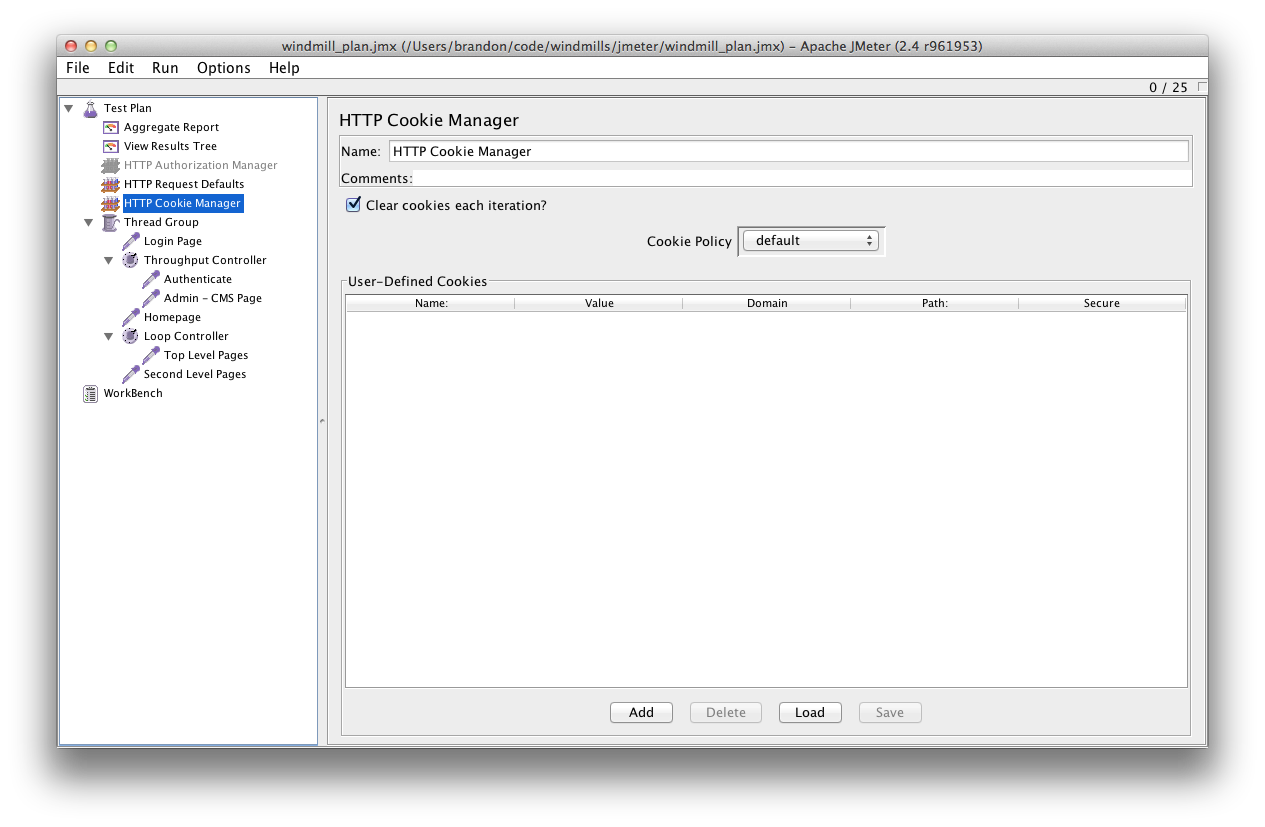
Enabling “Clear cookies each iteration” clears the cookies at the end of each loop giving each test loop a clean slate.
To handle authentication, simply create an “HTTP Request” using the POST method.
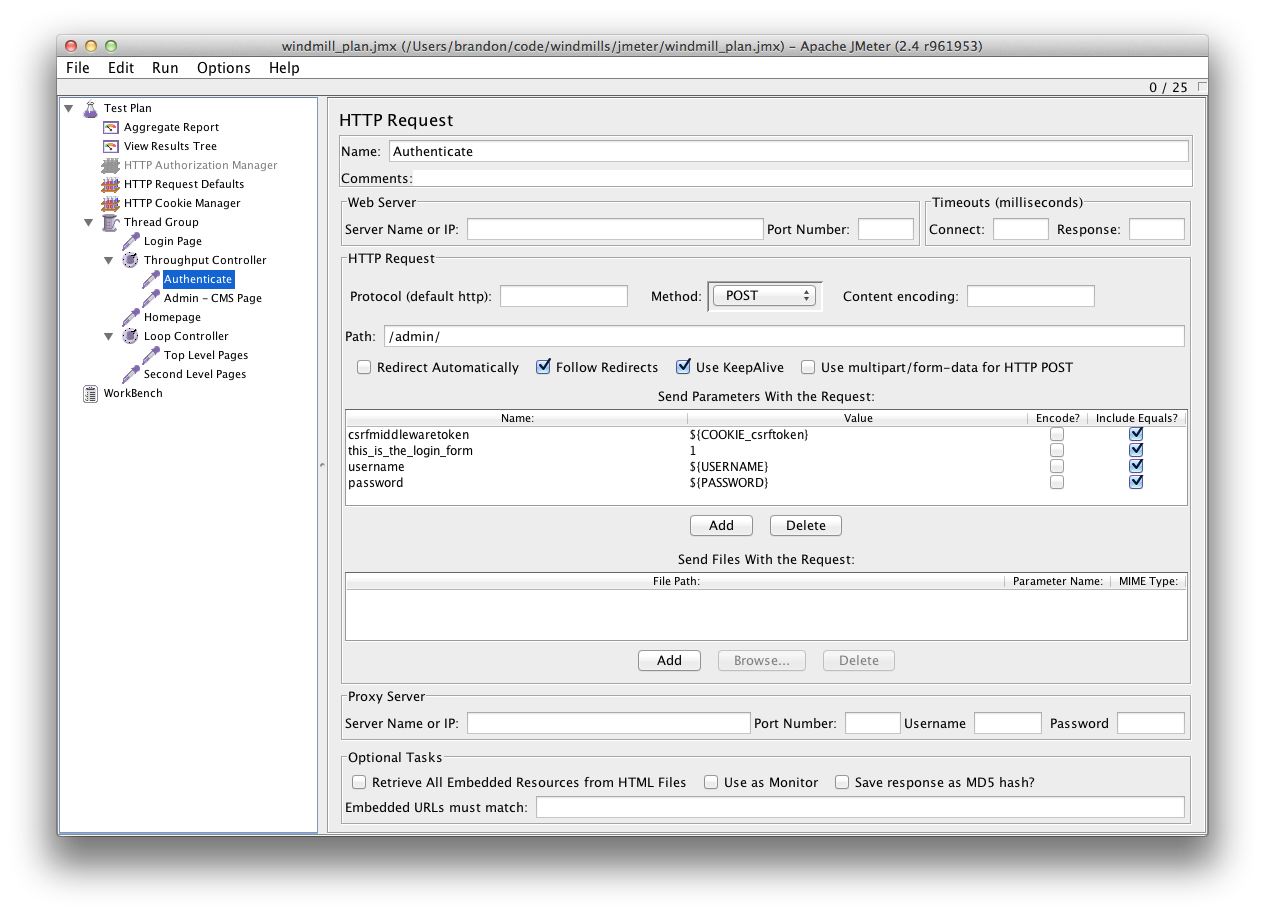
This is an example of logging in to Django’s admin. Note the “Method” is POST, and the following parameters have been added:
csrfmiddlewaretoken:${COOKIE_csrftoken}. A cookie automatically added by the CSRF Middleware on pages which require it.this_is_the_login_form:1Required for the Django admin login form.usernameUses the global Test Plan variable.passwordUses the global Test Plan variable.
Once a thread logs in, all its subsequent requests will be authenticated, until the cookies are cleared.
Tip
It’s a good idea to generate some admin activity during your test plan. Saving content can trigger large cache invalidations and admin pages often generate heavy database activity that can cause significant slow-downs for your application. On occasion, we’ve had to tweak admin views because the defaults taxed the database too heavily.
AJAX Requests
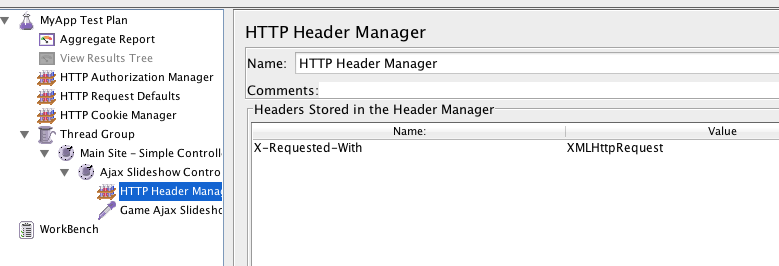
If your application behaves differently for AJAX requests, you can fake them in
JMeter by adding the X-Requested-With: XMLHttpRequest header.
To do this, right click on the thread group and select .
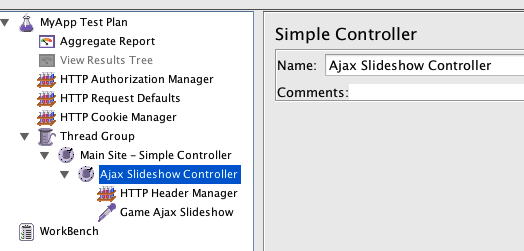
Once it’s named, right-click it and select . Create the “X-Requested-With” header with the value “XMLHttpRequest”.
Finally, create the HTTP Request that will use the special header.
This should give you what you need to run JMeter from your local computer against your development or soon-to-be production infrastructure. Running load tests from your local machine, however, is problematic for a couple of reasons. First, you may not have enough bandwidth to really saturate your site with connections. Second, you don’t want to tie up your local machine running slow load tests when you could be working.
It’s better to run a headless instance of JMeter from within your own infrastructure. This will remove the network complications of running it locally. You could run it from an unused dev server within the same network or spin up a cloud server with JMeter on-demand. We recommend not running it directly on a machine you’ll be testing because the additional load from JMeter will throw off the results.
JMeter can be installed with your package manager on most distributions. For Ubuntu/Debian, apt-get install jmeter will get you going.
Once installed, copy the jmeter folder you created earlier up to the
server, then fire it up with the following CLI
incantation:
jmeter -n -p user.properties \
          -t my_test_plan.jmx \
          -l my_results.jtl
-nis “nogui” mode-pis the path to the user.properties file-tis the path to the test plan-lis the path where JMeter should log the results
Reviewing the Log
When the test plan is done, the easiest way to view the results is to copy the
.jtl it created back to your local machine and open it in the JMeter GUI.
From a listener, there is a
Write results to file / Read from file. Click on the “Browse”
button there, and navigate to your .jtl file.
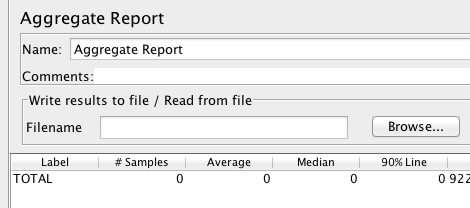
This loads up the listener as if you had run the test locally.
Integrating with Jenkins
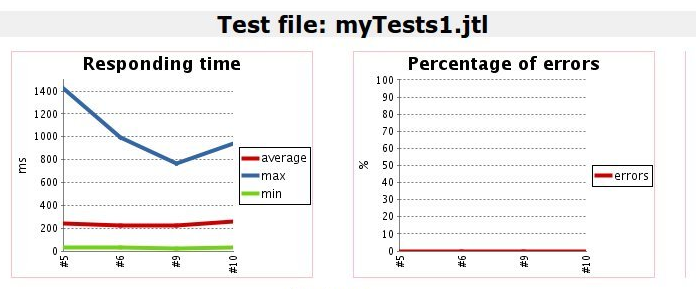
Manually running JMeter, copying, and loading up the results to inspect them gets cumbersome quickly. It also makes it hard to spot regressions in performance over time. If you use Jenkins for continuous integration, then its “Performance Plugin”[4] can be used to review graphical results, illustrating performance trends over time.
Here’s a simple script you can run in Jenkins:
#!/bin/bash

# Clear out old results
rm $WORKSPACE/jmeter.jtl

# Run the tests
cd "$WORKSPACE/jmeter"

jmeter -n -t test_plan.jmx \
          -l "$WORKSPACE/report.jtl" \
          -p user.properties
In the “Post-build Actions” section, enable the “Publish Performance test
result report” action. In the “Report files” field, point the plugin to your
log file, report.jtl.
At this point you can save the configuration, and you’re done! The performance test will run regularly on the schedule you entered, or you can run a test at any time using “Build Now”.
Interpreting the Results
Load testing with JMeter should give you a good indication of whether your site is capable of handling lots of traffic without falling flat on its face. But what if it’s not? How will you know?
You should get into a feedback cycle with JMeter in which you run a test, interpret the results, make calculated optimizations, and then re-test. Of course, you want to analyze JMeter’s output to make sure your error rate is zero (or very close to it) and that your response times are acceptable, but you also need to monitor your servers during the test runs. Confirm that your cache hit rates are healthy and no single service is running too hot, exhausting the server’s resources. This will give you a good chance to hone the skills you’ll need to effectively monitor and manage your production launch. We’ll go into further detail in The Launch chapter.
Launch Planning
The common expectation for a new site/feature launch is that you flip the switch one day and it is immediately live for all your users to see. This is a risky plan for a few reasons. No matter how much testing and planning you’ve done, you’ll never cover every possible scenario. And if there is a fault in the system, you are guaranteeing it will be a spectacular one affecting all your users. A better approach is to ease traffic onto the new system, allowing you to watch how it behaves and to react in a calm, calculated manner. In contrast, opening the flood gates will surely be a stressful event and have your team scrambling to patch holes on the fly.
In some cases, business needs will trump those of engineering and flipping the switch is the only viable option. In this scenario, you’ll either use DNS or load balancers to point traffic to your new application servers, with your team on high alert (more on that in the next chapter).
If you’re fortunate enough to be able to take a more calculated approach, there are a few different techniques to ease traffic onto your new infrastructure.
Use your load balancers to split traffic between old and new. Make sure you have enabled session affinity or sticky sessions so users won’t bounce between new and old.
Do a “dark launch” where users send traffic to the new infrastructure but don’t actually interact with it. This can be accomplished by having certain portions of your existing site trigger background AJAX requests to the new system.[5]
Invisibly proxy live traffic to the new infrastructure using something like Gor[6].
Use feature flags to release new features to a subset of your users. The folks at Disqus[7] and Lanyrd[8] have discussed the merits of this approach and how to successfully implement it in Django.
Tip
Sending traffic to your site with empty (a.k.a. cold) caches will cause a temporary load spike that can take your site down before the caches have a chance to warm up. Pre-warming your caches can help ease that initial spike. The process can be as simple as a script that crawls the most popular URLs on your site just before the real-world traffic hits.
Whichever scenario you choose, it’s important to have an emergency plan. What will you do if things go horribly wrong? In a perfect world, your launch will not prevent you from rolling back to the old system for a short period in the event of a catastrophic problem. If instead you burn the bridges behind you as you go, you could find yourself stuck on a sinking island. Having these discussions up front and thinking through the ramifications can save you from making a poor decision in the heat of the moment on launch day.
Tip
Don’t plan to launch at the end of a day or on Friday unless your whole team is expecting to work nights and weekends. You’ll want all hands on deck during your launch and for a few hours or days afterwards depending on how smoothly it goes. You also want to make sure your team is fresh and well rested in preparation. If the site has established traffic patterns, try to select a time when traffic is low.
Pre-launch checklist
The site is built, you have a plan to launch it, and you are confident that it can withstand the initial traffic without the servers melting to the ground. It’s time for one last sanity check so you don’t get caught with your pants down on launch day. Here’s a checklist to make sure you’ve dotted your i’s and crossed your t’s.
Django Configuration
DEBUGandTEMPLATE_DEBUGare set toFalseSECRET_KEYis a large random string and is, in fact, secret.ALLOWED_HOSTSlists any valid domain a visitor might use to hit your site:['.example.com']
TEMPLATE_LOADERS: Cached template loader is enabled:(('django.template.loaders.cached.Loader', TEMPLATE_LOADERS),)SESSION_ENGINEis something faster than the default. See SESSION_ENGINE for details.CACHES: A backend for Memcached or Redis. See CACHES for details.MEDIA_ROOTandMEDIA_URLare accepting and displaying file uploadsAdministrator accounts are limited and have strong passwords.
Deployment
A basic click-through of the site works as expected (no broken images or links).
Django logs are being written to file and/or being sent to a central aggregator.
Monitoring/metrics platform is receiving data. Make sure you can see failures at every layer of the stack.
Errors are being reported and triggering notifications.
Third-party services are live and receiving data (payments, analytics, etc.)
Outbound mail is flowing from your application servers and your Celery workers.
Custom error (500 and 404) pages are setup at every level (load balancer, web accelerator, Django).
Django admin is not publicly available at
/admin/.SSL certificate is valid and ciphers are secure[9].
Django-secure’s
manage.py checksecureruns clean.
Infrastructure
Servers and services are secured and locked down.
A simple and stable procedure is in place to deploy new code.
You have a plan to quickly scale services horizontally if needed.
DNS TTL dropped to 5 minutes or less if a change is required.
Are you feeling ready? It’s taken a lot of effort to get here and now it’s time to turn the keys and push the big red “Launch” button. In the next chapter we’ll show you how to watch for problems on the big day and handle the inevitable issues that will arise.