The Deployment
Deployment encompasses everything needed to make your code run on live servers, so getting it right is crucial to your site’s stability. Bad deploys can bring your entire site down or, worse, leave lingering issues that take weeks or months before they rear their ugly heads. If your deployment process is a nerve-wracking experience complete with sweaty palms and crossed-fingers, you’re doing it wrong. In this chapter, we’ll focus less on your Django code and more on the supporting cast of critical services for a high performance site.
Prerequisites
There are a few prerequisites to stable deployments that are outside the scope of this book but lay a critical foundation for stability. We’ll touch on them here, but if any of these concepts are new or unfamiliar, do your research before moving forward.
Tip
If you can get away with using a PaaS such as Heroku, it can save you massive amounts of time over building (and maintaining) everything from scratch. For high-traffic sites, however, a PaaS may be cost-prohibitive or too restrictive to be practical.
Operating System
Unix/Linux based systems rule the land for Django deployment. Ubuntu is the preferred distribution amongst Django developers but there are many other valid options. Unless you have lots of experience working with another distribution, just choose Ubuntu. If you do look at another OS, make sure:
It uses current packages. If you can’t easily use Python 3.5 or higher, choose another platform. CentOS/RHEL are notorious for being a version or two behind.
It will have security updates into the foreseeable future. We use Ubuntu LTS versions so we don’t have to rebuild our servers every year or two.
Configuration Management
Reliable deployments are impossible without a stable homogeneous platform across all your servers. If they have divergent configurations or different software versions you’re gonna have a bad time.
Configuration management lets you define what it means to be an “app server” and roll out new ones at will. There are lots of options in the configuration management space systems and the decision really comes down to experience and personal preference. Chef and Puppet have a lot of mind-share, but Python-based tools like Ansible and Salt are making headway. We have used both Salt and Ansible and are very happy with them.
Warning
Fabric is not a configuration management tool. Trying to use it as one will ultimately cause you heartache and pain. Fabric is an excellent choice for executing scripts in one or more remote systems, but that’s only a small piece of the puzzle. Don’t reinvent the wheel by building your own configuration management system on top of Fabric.
Process Management
As with configuration management, there are many options for making sure your services start when the server starts up, and get restarted in the event of a crash. We prefer to use the default OS tool, systemd rather than adding another layer of software into the mix.
In it’s simplest form, a systemd “unit” file for a service might look like this:
[Unit]
Description=My Service
After=syslog.target

[Service]
ExecStart=/path/to/my-service
Restart=always
User=myuser
Group=mygroup

[Install]
WantedBy=multi-user.target
Alternatively, you may find daemontools[1], supervisord[2], or circus[3] suit your needs better. Whatever you choose, this should be one part of your stack that never fails. If you find yourself fighting with it, consider choosing a different tool.
Shipping Your Code
Shipping a new build usually requires a number of steps:
Checkout the latest code from version control
Update dependencies
Migrate database
Collect, compress, and push static files to CDN
Reload WSGI server
Restart background workers
As with the rest of the process, simplicity is the key to making deployments repeatable and reliable. You can simplify this multi-step process by scripting everything so it only requires a single click or command. Anything more complicated than one step is an opportunity for human error to creep into the process.
A remote execution framework is the right tool for this job. Salt has remote execution baked in so that’s what we use, but Fabric is also a great option.
Warning
Once your site is up and running, you want to be very careful
about restarting services. Momentarily taking down an app server could drop
it out of your load balancer rotation. Whenever possible, look to
gracefully reload instead of doing a hard restart. uWSGI provides a number
of ways[4] to do this, perhaps the most convenient being the
--touch-reload option.
Multiple Remote Environments
Having multiple remote environments you can deploy to is a good idea for any website, but critical for large-scale operations. Non-production environments give your team a place to stage new features for feedback, QA builds before deployment, or test infrastructure changes without taking down production services. The number of environments you have depends on your work-flow, but plan on having at least two (staging/development and production).
As your production server farm gets larger, running an exact replica of its infrastructure becomes financially infeasible for development and testing. You can scale back both horizontally (fewer servers) and vertically (fewer resources per server), but try to keep the same general server/service layout. For example, in production, you may have separate server(s) for Varnish, uWSGI, and your database. On a low-traffic development server, all these services could run together on the same machine. This ensures the same stack is used to maintain parity, but reduces the cost of running non-production environments. Each separate environment should be completely isolated from the others, especially production. Your team needs to have confidence that they can break things in development without taking down production services.
Each environment should be as close to production as possible (settings, software, OS, etc.). There are few things more maddening for a developer than a bug that only shows up in production because of a lack of parity in the development environment. In your effort to reach environment parity, you’ll hit places where it conflicts with the goal of environment isolation. For example, you’ll definitely need to diverge in your third-party service configurations. You don’t want your development environment processing payments or sending files to your production CDN. Always favor pure isolation over exact parity in that battle.
One problem with maintaining a good development environment is populating it with data. It’s common to see people using a replica of the production database in development. If you’re considering this approach, also consider a few major risks associated with it:
Is your development environment as secure as production? Loosely monitored development machines are a common attack vector for black hats.
Is it possible to send out emails or other notifications from your application? Having your development environment accidentally send out thousands of emails to your users is not only embarrassing, but could impact the business as well.
A better approach is generate a “clean” version of your production database for development use. This database allows developers to work and test on the same scale as production without the risk of data leaks. Having a nightly task which anonymizes a recent snapshot of the production data will make it easy for for developers to grab a copy to work on locally.
Avoiding Single Points of Failure
Single points of failure are the sworn enemy of any good system administrator. In much the same way a server should be able to withstand the loss of a single hard drive, your infrastructure should be able to withstand the loss of a server without catastrophic results. When planning your infrastructure, remember that “the cloud” is unreliable and it is not uncommon for servers to suddenly become unresponsive due to underlying hardware issues. The
Netflix has gone so far as to build a piece of software that randomly kills production systems to ensure high-availability and fault tolerance (aptly named, Chaos Monkey[5]). This is probably overkill for your site, but that thinking can get you in the right mindset for avoiding SPOFs. Mentally go down your stack and think about what would happen in the event of a lost server or service at every level.
The loss of a stateless service like an application server is usually easy to withstand, but the loss of production data can be catastrophic. Make sure you know every place that data (databases, user uploads, etc) is stored in your system and that it is backed up. See also, Backup.
Note
As part of your planning, you’ll want to determine if high availability is a business requirement. HA is the process of automatically failing over when systems become unavailable without a service outage or manual intervention. The truth is that the cost of implementing HA often outweighs the cost of downtime.
Once you’ve worked your way through your stack, you’ll want to consider your hosting provider and decide how to handle their outages. Take for example, Amazon AWS. Do you need to be able to withstand an availability zone going down? How about an entire region? What if all of Amazon goes down? Answering and documenting these questions early on will avoid a lot of confusion and panic in the event of a real catastrophe.
What To Avoid
We shy away from bleeding edge tools, especially at the infrastructure level. Talk to many industry veterans and they’ll tell you the same thing. While it’s fun to play with and learn about upcoming technology, it’s decidedly less fun to debug it during a production outage. With the advent of commercially backed, VC-funded open source projects, it’s easy to get caught up in the hype machine created by their flashy websites, conferences, and marketing efforts.
A Word on Docker, Kubernetes, etc.
Docker and its surrounding ecosystem are very interesting, but are best used to solve problems most readers won’t have. On the surface, buying into this ecosystem makes a few things easier, but you’ll learn that doesn’t come without a price. You will be anchoring your infrastructure decidedly on the bleeding-edge. You’ll also learn about a whole host of new problems you didn’t have before.
That being said, Docker is a fantastic solution if you’re building a PaaS or work in an environment that has hundreds of unique codebases/services. If you have fewer than 50 or so, it may not be worthwhile.
If you are still convinced Docker is for you, strongly consider a managed platform such as Google Container Engine (GKE) that will handle the underlying software and infrastructure.
Server layout
By this point, you should have a good idea of how all the pieces of software work together. But how do they map out to physical/virtual servers? And what resources will those servers need? Let’s look at each component, starting at the top of our stack and moving our way down.
Load Balancer
Load balancers are simple traffic proxies and not extremely resource intensive. If you are hosting at a cloud provider such as Google or Amazon, using their managed load balancer offering is often an inexpensive and easy way to go. Otherwise, a medium-sized virtual machine setup with Nginx, Haproxy, or Varnish can proxy a surprising amount of traffic and still be mostly idle. Network throughput is the thing you need to keep an eye out for on these machines.
Web Accelerator
Your web accelerator can live in a few different places. It may do double duty as your load balancer and live on that box. It can be on a box of its own, or it can live on the same servers as your application. Putting it on your app servers means they won’t all share a cache which will lower the cache hit rate, but it also gives you more redundancy. Losing one simply drops that app server out of the load balancer pool instead of taking down the entire website.
Wherever it lives, it will need good network throughput and lots of RAM to store the cached responses in memory.
Application
Your application layer is typically going to be limited by CPU and/or RAM and is the first layer you’ll need to start scaling horizontally. A few smaller machines are preferable to a single massive machine for redundancy if one fails.
You’ll run multiple WSGI workers so each machine can serve multiple requests simultaneously and take advantage of every processor core. The exact number depends on a number of factors. See uWSGI Tuning for more info.
Background Workers
Background workers are often CPU bound and should run on their own servers. Like application servers, a single server can run many workers. They are also similar in that they are state-less and can easily be added and removed depending on workload.
Cache
Your cache machines need RAM and lots of it. A dedicated cache machine is rarely CPU bound and the disk speed will have very little effect on its performance. It’s hard to determine the right amount of RAM upfront, but it’s easy to see when you don’t have enough. With too little RAM, your cache will start doing LRU cache evictions. If you see the cache eviction rate going up and the hit rate decreasing, it’s a sign that your cache server could take advantage of more RAM.
Another consideration on caches is their network throughput. It may become a bottleneck before the RAM. If the network is becoming saturated, Django can be configured to distribute traffic across multiple servers. See CACHES for more.
Database
When spec’ing hardware for your database, don’t skimp. The database is usually the beefiest box in the server farm. The two most important things for a database are fast disks and lots of RAM.
A good rule of thumb is to have enough RAM to keep your entire dataset in memory. If you expect to have a 60GB database, spec out a box with at least 64GB of RAM. This will minimize the round-trips to disk to fetch data by letting your database cache all the data in memory.
Disk speed is important; buy the fastest disks you can afford. Fast hardware can defer expensive database optimizations, sometimes indefinitely. As Jeff Atwood says, “When does it make sense to throw hardware at a programming problem? As a general rule, I’d say almost always.”[6] If SSDs are in the budget, use them.
If you are deploying to a virtual machine, keep in mind you’ll be sharing physical disks with your neighbors. A common practice is to buy the largest virtual machine possible. Even if it has more RAM or CPU than you need, it usually guarantees you’ll be the only one on the physical hardware. This protects you from noisy/misbehaving neighbors. An added benefit is that it will give you access to more internal network bandwidth as well.
A Word on Auto Scaling
One of the promises of cloud computing is auto-scaling. As traffic to your site increases, new servers magically spin up to handle the load. When the traffic subsides, those servers get killed to save you money. Unfortunately, it’s an idea that has been overmarketed and leads people to believe that it will make any old website scale to billions of users. That’s pretty far from the truth, but there are a few places where auto-scaling can be effective.
Application servers are the perfect candidate for auto-scaling. They have no state (that lives in your database), they are all more or less identical, and it is easy to add/remove them to the load balancing pool on the fly. A typical auto-scaling rule will say that if some metric gets too high on your application servers (load, CPU, busy workers, etc.) then add another server to the pool. When the load subsides, pull it out and destroy the server. For sites with bursty traffic, auto-scaling can be a real money-saver.
Job queue workers are another place where auto-scaling can be very effective.
Auto-scaling does not, however, work as well on stateful systems such as your database. It’s possible to bring on extra database replicas to handle heavy read traffic, but bringing a new replica online is a time-consuming process with a large database and may require reconfiguring your application to utilize it.
One major risk with auto-scaling is simply pushing a problem farther down your stack. Remember, we want to keep as much traffic as we can in the higher layers of the stack for performance reasons. Adding application servers typically means more database traffic. If your database is already running hot, you’ll just be throwing logs on the fire.
Tuning the Stack
Once you’ve got your servers up and running and the software installed, you’ll want to take full advantage of all the resources your server can muster. To really make things hum, you’ve got to make some adjustments under the hood.
Database Tuning
Out of the box, Postgres and MySQL are not tuned for high performance. There are lots of knobs you can turn to improve performance and the exact settings are dependent on your workload. That being said, there are a few adjustments we can make up front to have a better starting point. Unless you’re a skilled DBA, the best bang for your buck is to give your database plenty of hardware, make these macro adjustments and then step back and let it do its thing.
PostgreSQL
The major settings you need to change out of the gate are the memory resources Postgres is allowed to consume. Adjusting these will let it make full use of the RAM you have in the system.
shared_buffers25% of RAM up to 8GBwork_mem(2x RAM) / max_connectionsmaintenance_work_memRAM / 16effective_cache_sizeRAM / 2max_connectionsless than 400
These numbers are pulled directly from Christophe Pettus’ talk, PostgreSQL when it’s not your job[7], an amazing resource on the topic of PostgreSQL configuration. Be sure to watch it or at the very least flip through his slides for more great tips.
MySQL
Percona has a slick configuration wizard[8] that should give you sane
defaults for your my.cnf. Note that MySQL has fewer options to fine-tune
memory usage than Postgres. To make full use of the RAM, set the following
value:
innodb-buffer-pool-size80% of RAM
uWSGI Tuning
uWSGI has an overwhelming set of options to tweak its performance and behavior. Here are a few of the common ones we use:
processesDetermine the number of concurrent requests your server can handle. A good rule of thumb is to start with double the processor cores in the machine and go up until you approach maxing out the CPU or RAM. If you have other services such as memcached or Varnish on your applications servers, you’ll want to start with fewer processes (number of cores + 1). To tune this, generate lots of traffic to the server and watch the CPU load. If the load exceeds the number of CPU cores, you have too many processes. If the CPU usage is not approaching 100%, you have too few.threadsIf your application is thread-safe, adding threads can be a lightweight option to further increase concurrency. Use thestatsoption (see below) anduwsgitopto determine the optimal number of processes and threads for your workload and available resources. Don’t confuse this with theenable-threadssetting which is a boolean to make it possible to use threads within your app.thunder-lockThis option will help uWSGI balance the load better amongst all the processes/threads. The uWSGI docs have a lengthy explanation[9] of what it does and why it is not the default behavior.harakiriThe maximum number of seconds a worker can take to process a single request before it is killed off. This will help keep runaway tasks in check and prevent all the workers from getting tied up with long-running requests.max-requestsDespite our best intentions, applications can leak memory over time. The correct way to handle it is to fix the memory leak at the source. As a stop-gap, however, you can tell uWSGI to respawn a worker after X requests, freeing up its memory. If you do decide to use this option, set it to a sufficiently high number so the server isn’t doing extra work to respawn workers every few minutes.post-bufferingThe max size of an HTTP request body in bytes (usually a file upload) that will go into memory. Larger requests will be saved to a temporary file on disk. Setting it to 4096 means that file uploads cannot bloat the memory of a process by more than 4MB as they are being read.statsThis option will publish statistics about the uWSGI process, including number of requests, average response time, memory usage per worker and more. It can use TCP (e.g., 127.0.0.1:1717) or a Unix domain (e.g.,/tmp/stat.sock) socket. You canpip install uwsgitopfor a nice text-based UI or push them into your metrics system for later analysis.auto-procnameA nicer human-readable process name that shows the purpose of each process, e.g. http, router, master.procname-prefix-spacedAdds a prefix to the process names. Useful if you are hosting multiple sites on the same machine.log-x-forwarded-forTypically you’ll be deploying uWSGI behind a proxy. This setting tells uWSGI to log theX-Forwarded-Forheader as the IP address instead of the actual IP of the request which will be your proxy.req-loggerFor troubleshooting and/or auditing purposes, this will log all requests received by uWSGI. A number of logging backends are supported, but simply logging to file viafile:/var/log/uwsgi/access.logis usually what you want.loggerThis will tell uWSGI where to output the error logs. These will contain any messages generated by uWSGI as well as anything your app writes to stdout/stderr. It uses the same logging backends as thereq-logger. See LOGGING for how to configure Django to log to stderr.
Tip
A common recommendation for improving WSGI performance is to use an asynchronous worker[10], e.g. gevent. In our experience, they are not a drop-in panacea for scaling problems. Even worse, these workers can wreak havoc in many subtle ways within your application. If you decide to use one, be sure you understand what it is doing and have done thorough testing up front. For more on this topic, see Glyph Lefkowitz’s article, Unyielding[11] or a write-up of our real-world experiences, Lessons Learned Architecting Realtime Applications[12].
Emperor mode
When running multiple sites or applications on a single server, uWSGI’s emperor
mode makes it easy to spin up new sites similar to Nginx/Apache’s
sites-enabled functionality. In the uWSGI world, each site is referred to
as a vassal.
The emperor takes over all process management of individual vassals. Adding a configuration file starts a new vassal, and deleting the file will kill the vassal process on the fly. Editing or touching the file gracefully reloads the vassal process. It will even monitor and respawn processes that have died unexpectedly.
To enable emperor mode, simply add the following line to the uwsgi section
of your configuration file:
emperor = /etc/uwsgi/vassals-enabled
Now any .ini file you drop into /etc/uwsgi/vassals-enabled will
automatically be read and the main (emperor) uWSGI instance will start up a new
vassal instance.
Tuning Django
Like the rest of our stack, some of the defaults in Django are suboptimal for high-traffic websites. Here are a few you’ll want to check.
CACHES
There are really only two viable options here, Memcached or Redis. If you are
using Memcached be sure to choose the pylibmc library for the best
performance and stability. There are a few third-party libraries for Redis, but
django-redis[13] seems to be leading the pack at the moment.
Out of the box, when used properly, these cache back-ends can provide a massive performance boost. Unfortunately, they are also susceptible to a few issues when used on a larger scale.
The first issue is the cache stampede (aka dog piling) problem[14]. Given
enough application servers and users, a cache key expiration can flood your
database and/or your cache server to refresh the key. Luckily, there’s a simple
way around this. If using django-redis setup the HerdClient [15]. On
Memcached, grab a package (actually just a single file) we wrote which solves
this, django-ft-cache [16] and use one of its “MintCache” classes.
Another gotcha with Django’s caching is that adding cache servers does not increase durability; it actually reduces it. Losing a cache service due to the server going down or network issues is a fatal error and will result in a “500 Server Error” being returned to the user. If you go from one to three cache servers, you are actually increasing the chance of failure.
To avoid this problem, we use twemproxy [17] a “fast and lightweight proxy
for memcached and redis”. Each of our app servers runs an instance of twemproxy
which is configured with the list of cache servers. A sample configuration file
for memcached looks like this:
pool:
listen: 127.0.0.1:11211
hash: fnv1a_64
distribution: ketama
timeout: 400
preconnect: true
auto_eject_hosts: true
server_retry_timeout: 30000
server_failure_limit: 3
servers:
 - 172.17.0.83:11211:1
 - 172.17.0.84:11211:1
 - 172.17.0.85:11211:1
The important thing that twemproxy provides which we don’t get from Django is
the auto_eject_hosts setting. You can tell twemproxy to stop querying a
server that is misbehaving. In our sample config, if a server fails to give
a successful response three times in a row (server_failure_limit), it will
be removed from the pool for 30 seconds (server_retry_timeout). At that
that point, twemproxy will try it again. This moves a cache outage incident from
catastrophic to, at most, three failed requests every 30 seconds. Your alerting
system should trigger a warning on the error so it can be determined if the
issue needs attention. With this setup, you simply point Django to the twemproxy
instance (in our case, running on localhost).
But what about those failed requests? Twemproxy recommends implementing a retry in the client library to ensure no requests fail. For most applications, the cache is intentionally ephemeral and a random get/set failure can safely be ignored by the application. In this case, we can modify the cache backend to treat get failures as a cache miss and simply ignore sets that don’t succeed. This will put more pressure on your database, but in the event of a transient issue, it may be better than serving error pages.
We released django-ft-cache[18] which offers this functionality
by simply wrapping any memcached operations in a try/except block.
Exceptions are caught so the request can continue, but logged so an
administrator can take action if a server has actually failed.
Django docs: https://docs.djangoproject.com/en/dev/ref/settings/#caches
SESSION_ENGINE
The database is the default storage for sessions. Since we want to touch the database as little as possible, having every request hitting it is a no go. This is easy to swap out for a nice little performance boost.
The cache backend is a good option, especially if you are using Redis and
it is configured to persist to disk.
The cached_db backend works well if you use Memcached, but want to ensure
your sessions survive a cache restart. This backend will still hit the
database, but far less than the default backend.
Another option is to use the signed_cookies backend, letting your clients
store the data and pass it back with every request. There are some risks
involved with this approach, so be sure to read up on the notes in the docs
[19].
DATABASES
You’ll want to add the CONN_MAX_AGE key to any database defined in your
DATABASES setting. For backwards compatibility reasons this feature is off
by default. 300 is a good value to start with if you’re unsure. That tells
Django to hold open and reuse database connections for 5 minutes. None can
also be used to recycle them indefinitely.
Django docs: https://docs.djangoproject.com/en/dev/ref/settings/#databases
LOGGING
Django can log directly to a file via Python’s logging module, but we
recommend against it. It is a common source of file permissions issues,
especially if you have developers or admins hopping on a server to inspect
data via manage.py shell. If Django can’t write to the log file it will
crash on startup and hair-pulling will ensue.
Instead, output to STDERR and either have uWSGI log this to file using the
--logger option, or pick up the output with your process manager (upstart,
systemd, supervisor, etc.).
Django sets up some default logging automatically, some of it good (request
logging when using runserver), some of it bad for high performance use
cases (emailing admins on errors, discussed later in this chapter). It’s best
just to bypass Django’s default logging altogether, redefining what you want
to keep to avoid hidden surprises. Here’s an example:
import logging.config
import os
from django.utils.log import DEFAULT_LOGGING

# Disable Django's logging setup
LOGGING_CONFIG = None

# Allow loglevel to be changed with an environment variable
LOGLEVEL = os.environ.get('LOGLEVEL', 'info').upper()

logging.config.dictConfig({
    'version': 1,
    'disable_existing_loggers': False,
    'formatters': {
        'default': {
            # exact format is not important, this is the minimum information
            'format': '%(asctime)s %(name)-12s %(levelname)-8s %(message)s',
        },
        'django.server': DEFAULT_LOGGING['formatters']['django.server'],
    },
    'handlers': {
        # console logs to stderr
        'console': {
            'class': 'logging.StreamHandler',
            'formatter': 'default',
        },
        'django.server': DEFAULT_LOGGING['handlers']['django.server'],
    },
    'loggers': {
        # default for all undefined Python modules
        '': {
            'level': 'WARNING',
            'handlers': ['console'],
        },
        # Our application code
        'myproject': {
            'level': LOGLEVEL,
            'handlers': ['console'],
            # Avoid double logging because of root logger
            'propagate': False,
        },
        # Default runserver request logging
        'django.server': DEFAULT_LOGGING['loggers']['django.server'],
    },
})
Tip
uWSGI has some pretty advanced logging options[20] that will let you stream its request logs and your application logs to different locations. You can even filter logs based on regular expressions.
Django logging docs: https://docs.djangoproject.com/en/dev/topics/logging/#configuring-logging
MIDDLEWARE_CLASSES
Be very careful with custom middleware. It’s a code path that will execute on every request to the application, so make sure you know what each one is doing and avoid database queries in middleware whenever possible.
Django docs: https://docs.djangoproject.com/en/dev/ref/middleware/
General Security
There are a handful of bits you can flip to make sure your site isn’t vulnerable to
exploits like clickjacking and XSS. The easiest
way to enable all these is via the django-secure project[21]. Simply
install it and run manage.py checksecure to verify your production
installation. In some cases, your project requirements may not allow you to
enable all of the security features. In that case, make sure you understand the
trade-off, and that your reasoning has been documented for future developers. OWASP[22] is a great resource for understanding why all these options are important.
On the topic of security, make sure your administration interface is adequately protected. If it’s open to the public, one weak admin password can take down your whole site. Treat it like any other internal service and don’t leave it open on the public internet. See also, Protect internal services.
Web Accelerator
Unlike some of the other services, Varnish won’t “just work” out of the box. It requires configuration and also thought about how your application works and where you can take advantage of its caching. The end goal is to have Varnish serving as much of your traffic as possible, protecting the slower services that sit below it in the stack.
First, you need to determine what content can be shared between users. The simplest example is traffic that comes from anonymous (not logged in) users. You want Varnish to cache the response to any request from an anonymous user and serve it back to other anonymous users visiting the same URL.
Varnish uses a domain specific language called VCL that looks a lot like Perl or C. We’ll only scratch
the surface of it here, but they have extensive docs[23] and it’s usually
possible to find snippets that do what you want after a couple of Google
searches. The default location for the Varnish configuration is
/etc/varnish/default.vcl.
Warning
We are targeting Varnish 4.1.x in our examples here.
Be forewarned that a number of backwards incompatible changes[24] have been made since version 3. Unfortunately, any snippets you find on the internet may need adjustment to work in version 4.
Tip
Debugging your VCL configuration is not always a piece of cake. You may
find the Varnish log function (std.log("...")) helpful to confirm the
path a request/response takes through your configuration. For performance
reasons, Varnish does not log to a file by default. You can get a realtime
stream of the log, however, by using the bundled command varnishlog.
Defining Backend(s)
Before you dive into configuring how Varnish handles requests, you need to tell Varnish how to talk to your application servers (“backends” in VCL). Here’s a simple example:
backend mysite {
    .host = "127.0.0.1";
    .port = "8080";
}
This block tells Varnish that our Django site is available at http://127.0.0.1:8080. Multiple backends can be defined and load balanced using directors[25].
vcl_recv Subroutine
Varnish uses a predefined set of “subroutines” to allow you to customize how it behaves during
different stages of a request/response cycle. The first one we’ll use is
vcl_recv. It is called when a request is received, and is used to
modify it before it does a cache lookup.
Varnish caches responses based on the URL and the contents of the headers
defined by the Vary header. A typical browser request may vary on
Accept-Encoding and Cookie. For anonymous requests, the cookies rarely
matter (and are often set by third-party analytics platforms). You’ll improve
your hit rate greatly by stripping them out so the anonymous requests all look
the same.
Here is a simple example that will bypass the cache for logged-in users and strip the cookies for anonymous users[26]:
sub vcl_recv {
  # bypass the cache for logged in users
  if (req.http.cookie ~ "sessionid" ){
    return (pass);
  } else {
    unset req.http.Cookie;
  }
  return (hash);
}
Another helpful snippet you can place in your vcl_recv is a cache bypass
mechanism. This will check for the presence of a pre-defined URL parameter
and, if defined, pass the request straight to the backend. These can be handy
for troubleshooting.
if (req.url ~ "(\?|&)flush-the-cache") {
    return(pass);
}
If you use the same name you defined earlier for your template cache (see Custom Cache Template Tag), it will give you a simple way to bust straight through your cache all the way down to the application and database layers.
This subroutine is also a good place to handle permanent redirects, domain
name normalization, and dropping requests for URLs that you know don’t exist
in Django (/favicon.ico for example). Remember, the more requests you can
stop here, the less work your application needs to do. Here’s an example that
drops all requests for common static files:
if (req.method == "GET" &&
    req.url ~ "\.(jpg|jpeg|png|gif|ico|js|css)$") {

  return (synth(404, "Not Found"));
}
Improving Your Hit Rate
This simple setup will get you up and running with Varnish, but you’ll probably have a lot of room for improvement on your cache hit rate. The Varnish docs have some recommendations on how to improve your hit rate[27]. If your site is mostly anonymous traffic, however, this will get you pretty far.
On sites where users are logged in and page content varies for every user, things become more challenging. The solution you choose will be very specific to your application, but the basic technique will probably be the same. You’ll need to think about how you can split up your pages such that some expensive parts don’t vary per user. In some cases, the only difference is the user name displayed on the screen. For these sorts of pages, you can still take advantage of Varnish by splitting up the page and using a two-phase rendering process.
One option is to have Django render an anonymized version of the page for Varnish to cache, then use AJAX to make an additional request filling in the personalized bits. This gets the initial page to the user as quickly as possible, but there will be a delay as the second request is fired to get the personalized information.
The other option is to use ESI and let Varnish use that information to assemble the page for you. For more details on this approach, see Varnish’s Edge Side Includes documentation [28].
Grace Periods
Grace periods are a lesser known gem inside Varnish that lets you serve stale content from cache if your application servers become unavailable.
Here is a simple VCL snippet to enable this feature:
vcl 4.0;
import std;

backend default {
  .host = "127.0.0.1";
  .port = "8080";
  .probe = {
    .url = "/";
    .interval = 5s;
    .timeout = 1s;
    .window = 5;
    .threshold = 3;
  }
}

sub vcl_hit {
  if (obj.ttl >= 0s) {
    # A pure unadulterated hit, deliver it
    return (deliver);
  }
  if (!std.healthy(req.backend_hint) ||
      (obj.ttl + obj.grace > 0s)) {

    # backend not healthy or within the grace window
    return (deliver);
  }
  return (fetch);
}

# Happens after reading the backend response headers
sub vcl_backend_response {
  set beresp.grace = 6h;
  # Force the TTL to 20s
  set beresp.ttl = 20s;
  return (deliver);
}
Note
Every 5 seconds, Varnish is going to probe your application server
at the URL defined (in this case, “/”) to determine if it is healthy. If
less than 3 (threshold) out of 5 (window) probes pass, the
backend is declared unhealthy. See the Varnish docs on health
checks[29] for more details.
To confirm your configuration is working:
Fetch a URL in Varnish, loading it into the cache.
Wait for the content to expire (in this case the TTL is 20 seconds).
Drop your application server by killing the uWSGI process.
Fetch the same URL through Varnish again.
On the second fetch, you should see a response like this:
$ curl -I http://127.0.0.1:6081/
HTTP/1.1 200 OK
Content-type: text/html
Last-Modified: Mon, 17 Feb 2014 10:19:03 GMT
Date: Mon, 17 Feb 2014 10:55:14 GMT
X-Varnish: 976346113 976346109
Age: 127
Via: 1.1 varnish-v4
Connection: Keep-Alive
Note the Age: 127 header. This tells you the number of seconds since
Varnish fetched this page from your web server. If it is greater than the TTL,
but you still receive the cached page content, you’re in business.
Congratulations, you’re now serving Django without Django! Varnish’s grace periods are a nice safety net when the unexpected (but inevitable) happens, and can buy you some time to get things back into working order.
Custom Error Page

You’ve probably seen one of these at some point while browsing the web. It’s Varnish’s default error page and, as you can see, it isn’t particularly user friendly. To provide a nicer HTML page to the end user when your application fails, use a snippet like this:
sub vcl_backend_error {
    # Otherwise, return the custom error page
    set beresp.http.Content-Type = "text/html; charset=utf-8";
    synthetic(std.fileread("/var/www/error.html"));
    return(deliver);
}
You probably want this error page to look just like the error page generated by
the 500.html page from Django. It’s likely, however that your 500.html
file is a template and not straight HTML. Here’s a simple management command
that can render that out to HTML in the console.
from django.core.management.base import BaseCommand
from django.shortcuts import render
from django.test import RequestFactory


class Command(BaseCommand):
    help = "Generate HTML for 500 page"
    def handle(self, *args, **options):
        request = RequestFactory().get('/')
        print(render(request, '500.html').content)
Periodically (or as part of your deploy process), you can run
manage.py generate_500_html > /var/www/error.html to make sure your Varnish
(or other proxy server) error page is always fresh.
Redirects
Since Varnish is so fast, it’s a good place to handle any hard-coded redirects you might need to serve your application. Unfortunately, Varnish doesn’t provide a built-in “redirect” command, so you need to jump through a couple hoops to make it happen.
Here’s an example of redirecting requests on the “naked” domain to the
www. subdomain.
sub vcl_recv {
  if (req.request == "GET" &&
      req.http.host == "example.com") {

    return (synth(801, "http://www.example.com" + req.url));
  }
  return (hash);
}

sub vcl_synth {
  if (resp.status == 801) {
    set resp.http.Content-Type = "text/html; charset=utf-8";
    set resp.http.Location = resp.reason;
    set resp.status = 301;
  }
  return (deliver);
}
The redirects can be conditional on any number of variables beyond just
url, including paths, cookies, and headers.
The use of 801 is somewhat arbitrary. We’re taking advantage of an
undefined HTTP status code that we know will only come from inside Varnish.
This effectively creates a GOTO statement which passes redirects to a
Varnish function that can send a response to the user. Similarly, you could
use status code 802 to handle temporary 302 redirects.
Purging the Cache
In some situations it’s handy to be able to purge a single URL from Varnish’s
cache immediately. This is another case where we’ll stray from the HTTP specs
and implement a custom method named PURGE.
acl purge {
  "127.0.0.1";
}

sub vcl_recv {
  if (req.method == "PURGE") {
    if (!client.ip ~ purge) {
      return(synth(405, "Not allowed."));
    }
    return (purge);
  }
}
The example above lets you craft an HTTP request that will force Varnish to
invalidate its cache for the given URL (but only if its source IP address is
in the ACL named purge).
$ curl -I -XPURGE http://localhost:6081/
HTTP/1.1 200 Purged
Date: Wed, 16 Jul 2014 07:56:09 GMT
Server: Varnish
X-Varnish: 9
Content-Length: 0
Connection: keep-alive
Accept-Ranges: bytes
Tip
Be careful, with what addresses you allow to make a PURGE call to
Varnish. If misconfigured, it would allow a malicious hacker to execute a
DDoS on your site by continuously flushing your cache. See the Varnish
documentation on purging[30] for further information on acl.
Configuring your Servers
The prevalence of cloud servers and good configuration management tools has made it possible to get complex server farms up and running without being a systems administration guru. This is a blessing and a curse because you can end up in the deep-end of the pool without ever having learned how to swim. Once you have your server farm deployed, you need to make sure you haven’t left the doors wide open for the bad guys to waltz right in. In addition, you have to ensure your data is safe in the event of a hardware catastrophe (or fat fingers). We’ll just touch on some basics of system administration here, but if you don’t have anyone on your team that has experience managing servers, consider some further reading on the subject[31].
Security
While most modern distributions are reasonably secure out of the box, there’s a few more steps you should take for a machine that will be accessible on the public internet. Here’s a bare minimum list to consider. If you are deviating from it, make sure you fully understand the risk and possible ramifications.
Lock Down SSH
Disable root login (use sudo) and disable password logins (keys are
stronger) with the following two lines in /etc/sshd_config:
PermitRootLogin no
PasswordAuthentication no
You may also want to consider changing the port SSH listens on as an
additional measure using the Port variable. While a savvy black hat can
still find it, it will be hidden from the swarm of automated scripts that test
SSH on port 22.
Patch Regularly
Establish, and stick to, a schedule to patch your servers at least every few weeks. Have a plan in place for expediting critical zero-day patches (e.g., Heartbleed).
Use the Private Network
Most cloud server providers offer private networks that are only accessible to the servers within your account. Connecting your servers on the private network makes it harder for people to snoop on your traffic. A nice side effect is that the internal network is often a cheaper (and faster) path between servers because providers rarely meter traffic on them.
Protect internal services
Internal services include things like dashboards, development servers, or your continuous integration system. They can also become a back-door into your protected network, leading to a breach. Lock them down with a VPN or an authentication proxy like Bitly’s google_auth_proxy[32]. If you don’t use a VPN, make sure critical data and login credentials are always sent over SSL/HTTPS.
Locking down your development environments will also ensure that Google doesn’t accidentally crawl it, killing your SEO in the process :)
Firewall
Only allow traffic into your server on the ports and IPs you’re expecting.
Hardware firewalls are great, but even software firewalls like iptables
will get the job done. Also note that many cloud providers provide this as a
service (e.g. Security Groups on AWS or the aptly named, “Firewall” on GCP).
Don’t run as root
Use the principle of least privelege[33] to make it harder for someone to
leverage a RCE to gain root level access to your
server. This applies to standard users logging onto the server as well. Use
sudo, but only when necessary.
We setup a dedicated user to run our application. This user will only have access to the code for the site. The process manager will execute uWSGI and any background jobs as this user.
Secure your third-party endpoints
Locking down your servers won’t help you at all if somebody can modify your code on GitHub, delete servers from your IaaS, or steal your password reset confirmations via a hijacked email account. Use strong passwords and enable two-factor authentication when possible.
Backup
Backups: you absolutely must have them. If you woke up and all your servers were gone, what would you be missing? Your configuration management system should be able to get the infrastructure up and running quickly, but you’ll also need all the data in your database and anything that might have been uploaded by your users (aka “state”).
Managed Services
The simplest, and perhaps safest, solution here is to put all your state in managed services that handle this for you. Unless you have a team of veteran system admins on top of this, they will almost certainly do a better job than you would in-house. The major providers all have offerings here. You’ll want to ensure that these services are geographically close to (if not in the same datacenter as) your application servers to avoid any additional overhead. Some popular and well-tested managed services include:
Databases: Amazon RDS, Google Cloud SQL, Citus Cloud, Heroku Postgres
File Storage: Amazon S3 or Google Cloud Storage with versioning enabled
Self Hosted
If you’re going to be hosting these services on your own, you’re on the hook for setting up a backup strategy and ensuring it works every time. Presumably, at this point, you really know what you’re doing and any information presented here is redundant. In any case, here’s a bare-bones checklist for you:
Do you have a live replica of your database that you can make easily
switch over to in the event of a primary outage? Have you tested rolling over
to it?
* Do you have full database snapshots (via pg_dump or mysqldump)
at least daily for at least a couple weeks accessible (and secure)?
* Do you have the option for point-in-time restoration via a log shipping
solution like WAL-G[34].
* Can you restore a file that was deleted two weeks ago?
* Can you restore a version of a file that was overwritten to an exact point-in-time?
Additional Considerations
In the old days, it was critical to maintain a current copy of your backups off-site in case of a catastrophe in your data center. While still important, the concept of off-site is a bit more nebulous in the cloud. Depending on the level of risk you’re willing to assume, “off-site” could be:
A geographically distributed storage provider such as Amazon S3
A server in a different datacenter/region with the same provider
A totally different cloud/colo provider
A few more questions you should consider with regard to backups:
If somebody hacks into one of your servers, can they delete or corrupt your backups? Pulling to the backup server might be better than push for this reason.
How bad would it be if somebody got their hands on your backups? Consider encrypting them in such a way that a hacker couldn’t decrypt them with information found on the same machine.
Finally, backups are only as good as the last time they were tested. Make it a point to regularly test some common restore scenarios to verify your data is safe in the event of a catastrophe. Even with managed services, if they aren’t configured correctly, you may not have the backup coverage you’d expect.
Tip
- Pretty much everyone hates testing backups. If they always work, it feels
like a waste of time and then people stop doing it. Take some time to script the restore process to remove any friction from the process.
Monitoring
You can’t manage what you don’t measure.
—Bill Hewlett
Without monitoring, production websites are big black boxes. You have no insight into what is happening with the various pieces inside. And it is impossible to improve performance if you can’t see what is happening. Moreover, a live application will behave very differently than the version running on your laptop. The different layers of the stack will often end up fighting for scarce resources (RAM, CPU, I/O), impacting the overall performance of the system. Monitoring and instrumentation are the only ways for you to gain insight into the dynamic behavior of your application infrastructure.
Instrumentation
Application instrumentation is the equivalent of the gauges on your car’s dashboard. They tell you how fast you’re going and what resources you’re using. Your goal is to have instrumentation that can give you immediate answers to the following questions:
What is the slowest part of my system? A time breakdown per request of Python, SQL, cache, etc. is ideal.
What is the average response time for a request hitting Django?
Which views are the slowest and/or consume the most time?
Which database queries are the slowest and/or consume the most time?
How are all these numbers changing over time?
NewRelic[35] is a fantastic tool to capture this information and can be setup very quickly. Unlike the rest of our stack, however, NewRelic is a closed-source, proprietary system. It is great to get you started, but can be expensive and lacks the flexibility of open source alternatives.
The de-facto open source metrics collection platform today is Graphite[36]. It does two things very well:
Stores incoming numerical data in an RRD-style database.
Provides an API to query the data, returning either PNG graphs or JSON data.
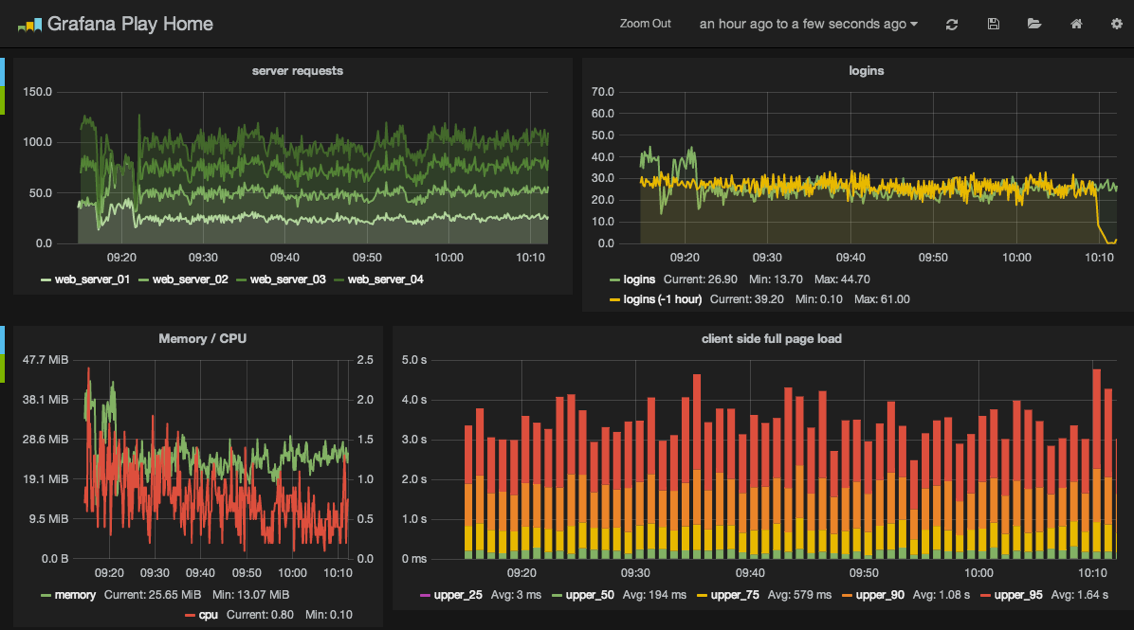
Setting up Graphite could probably be an entire book on its own, but there are plenty of tutorials online you can follow. It’s built in Django, so the setup should feel familiar. A couple of tips: check out the graphite-api project[37] for a pared down modern implementation of Graphite’s API endpoint, and pair it with Grafana[38], an excellent “single-page app” dashboard for building and viewing graphs.
Our focus in this book is helping you collect the data you need and getting it to Graphite. In addition to instrumenting Django, you’ll want to track data from all our other pieces: load balancers, web accelerators, server resources, etc. The more data you have, the easier it will be to make informed decisions about where to optimize.
Unfortunately, Django isn’t built with all the hooks you need to carry out this
sort of instrumentation. Thankfully, there’s a package that bundles up what
amounts to a series of patches to put timers in the nooks and crannies we want
to instrument. Django Statsd[39], found on PyPI as django-statsd-mozilla due to a naming conflict, is a drop-in
package which will publish the numbers we’re interested in to Statsd[40].
Statsd in turn, can publish to Graphite. Alternatively, Heka can masquerade as
a Statsd endpoint[41], making our stack one service simpler.
In addition to pushing to Statsd, Django Statsd can also push the data to a log or even Django Debug Toolbar, making it handy to use in local development as well.
Note
The current PyPI release of Django Statsd does not include the total time spent in SQL or cache for each request. This makes it difficult to graph the amount of time spent in each service per-request, similar to what NewRelic provides. Based on some similar code written by Simon Willison, we have a pull request upstream to provide this capability[42].
Server Resources
Application metrics are important, but they don’t make a difference if your server runs out of disk space or starts swapping. Be sure you push your servers vital signs into your preferred monitoring tool including:
Load average
CPU load
Physical memory usage
Disk utilization
Network I/O
Again, NewRelic can handle this or you can push to Graphite using any number of tools. Collectd[43] is also a popular option, or for a pure Python service, consider the Diamond project[44] by Brightcove. At Lincoln Loop, we use Salt to collect and push this information to Graphite. Since we already use it, it’s one less process we have to manage.
Alerting
The next logical step in monitoring is to receive alerts when a metric starts getting into the warning zone. It’s much easier to deal with problems before they become catastrophic, affecting the business and your end-users. Alerting may seem easy on the surface, but it’s a tough problem to get right and a place where mistakes can hurt badly.
NewRelic has basic alerting baked in. “Serious” open source tools like Nagios[45] and Riemann[46] can interact with Graphite, but also come with a steep learning curve. Less mature options such as Django-based Cabot[47], seyren[48], and rearview[49] are also available.
A few ideas on when to send alerts:
Errors are above X% of requests
Server down
High server utilization: load, swap, disk, etc.
Service not responding
Logging
Not all data can easily be boiled down to a single number for Graphite. For everything else, you’ll want to use a log aggregator. Splunk[50] and Loggly[51] are popular commercial services, but we prefer the combination of ElasticSearch[52], Kibana[53], and Heka[54] which provides similar functionality in an open source package. You may also see people using Logstash[55] in place of Heka to accomplish the same task.
This layout is very similar to the stack we prescribed with Graphite.
Kibana :: Grafana (dashboard)
ElasticSearch :: Graphite (storage/API)
Heka :: Statsd (transport)
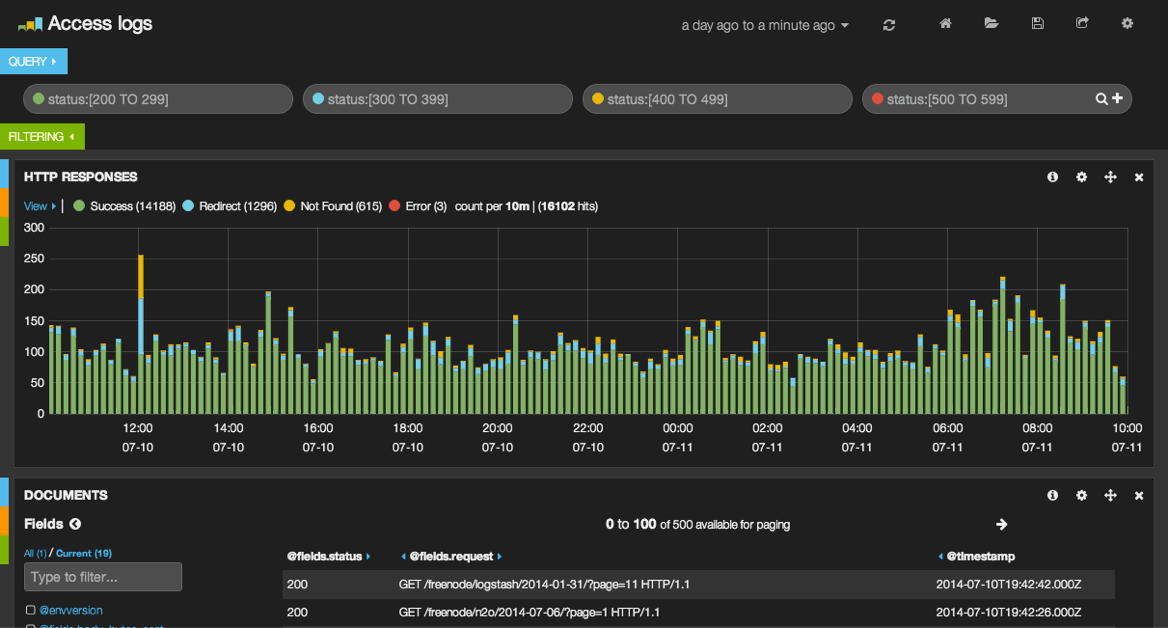
Once your app is spread across several systems, grepping log files can be very challenging and finding patterns is almost impossible. Kibana presents all that text data in a visual fashion. You can use it to search for specific log conditions, present histograms of those events over time, break down or segment the info, and much more. When you hit a tougher problem that requires searching for the needle in the haystack, or you need data to back-up an ops-related theory, this combo is invaluable.
You’ll want to collect:
Apache-style logs that go all the way from your Load Balancer down to your application, ideally with a unique stamp that will let you track the request as it traverses your stack.
Any in-application logging.
Syslogs of any critical services.
At a minimum, slow database queries but possibly all queries if you can ship them without causing I/O contention with the database (separate disk or over the network).
Error Reporting
Django’s default method of error reporting is to email a site administrator when a traceback is encountered in production. This feature is a blessing on low-traffic websites where errors might otherwise go unnoticed. On high-traffic websites, however, this feature can cause serious problems.
Email is a horrible tool for tracking frequency in errors and changes over time.
If you end up with an error on a high-traffic page, you can DoS your mail server, get blacklisted, or have your email provider pull the plug on your service (they tend to frown upon 10k emails being sent in a couple seconds).
Luckily, better options for error reporting already exist. Again NewRelic is an option here, but the open source Sentry[56] project is better suited to this task. Like Graphite, it is written in Django. Originally an internal tool at Disqus, it has spun-off into its own product with both a paid hosted version and free local installation options. Sentry will give you a nice dashboard to track errors in your application. You can send error reports from a number of other languages beyond just Python with it’s client application, raven[57]. There’s even a JavaScript version that will let you track errors in your client-side code as well. With Sentry, instead of getting hit with 10k emails, it will only email you on the first one, then collect and aggregate the rest in its web interface for analysis.
Tip
On the topic of errors, one drawback to having multiple layers in front of
your application is that an error could be raised at any level in the stack.
Even if you have a pretty Django 500.html template setup, your web
accelerator and load balancer will return ugly un-styled pages if they
encounter an error trying to communicate with the next layer in the stack.
As part of your deployment process, you’ll want to make sure you dump out a
flat HTML file and configure these services to use it.
At this point, you should have your server farm operational, but how do you know it is ready for production traffic? In the next chapter we’ll discuss launch preparation so you can confidently take your site into production.