Part 1 | “Part 2”/blog/2011/oct/12/load-testing-jmeter-part-2-headless-testing-and-je/ | Part 3
The Headless Horseman (Running JMeter in No-GUI Mode)

If you read Part 1 of my JMeter series, you now know how to create a JMeter performance test with as much complexity as you need to hit every part of your application and push it to its limits. As mentioned at the end of the post, though, when running your test plan from your local machine you are often limited by bandwidth. The test plan may not be able to fully stress your application because it can’t transfer data fast enough for all of your concurrent connections. To really push your application hard, you need to run your load test from the same local network that your application runs within.
If you’re testing your staging or production infrastructure, you could run JMeter from a dev server within the same network. If you’re on a cloud platform, you could manually spin up an image with JMeter on-demand whenever you want to run a load test. Wherever you put it, you just want to make sure that you’re not running JMeter from one of the servers that you will be testing. The load imposed on the test machine will almost definitely skew your performance results.
On Debian-based distributions like Ubuntu, JMeter is very easy to install.
$ sudo apt-get install jmeter
$ jmeter -n -p user.properties -t my_test_plan.jmx -l my_results.jtl
Reviewing the Log
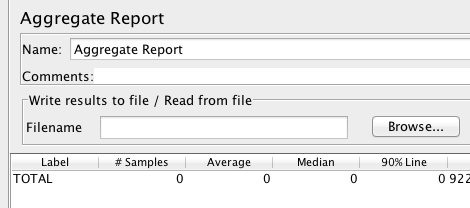
When your test plan is done, you’ll be returned to the command prompt. You can then copy your newly created .jtl file over to your local machine so that you can begin reviewing your results. Open your test plan on your local machine using JMeter’s GUI, and take a look at one of your listeners. You should see a section that says “Write results to file / Read from file”. Click on the “Browse” button there, and navigate to your .jtl file.

When you open your log file, your listener should be filled with data that you can now review just like you would if you had run the test locally.
Integrating with Jenkins
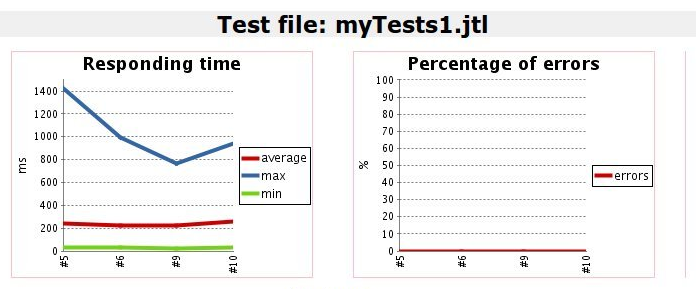
If you use Jenkins (the continuous integration tool formerly known as Hudson), then you can take advantage of the Performance Plugin to easily trigger JMeter runs from your Jenkins server and review graphical results illustrating performance trends.
To install the performance plugin, navigate to “Manage Jenkins → Manage Plugins → Available → Performance Plugin”. Select the plugin, click on the “Install” button at the bottom of the screen, and you’re ready to go.
There are many ways to configure the plugin, but one way that we’ve found effective is to simply create a separate job for the JMeter tests set it to run on a regular schedule, such as nightly at midnight. In the job configuration, add the source control information so that Jenkins will check out your test plan in the job workspace. Under “Build Triggers”, select “Build periodically” and add a cron-style schedule.
# midnight PST = 7am UTC
0 7 * * *
#!/bin/bash
echo "### Running JMeter performance test ###"

# Clear out old results
rm $WORKSPACE/jmeter.jtl

# Run the tests
echo "## Running the tests"
cd "$WORKSPACE/jmeter"

jmeter -n -t test_plan.jmx -l $WORKSPACE/jmeter.jtl -p user.properties
$WORKSPACE/jmeter/jenkins.sh
$WORKSPACE/jmeter.jtl

Next Time
That’s it for today! You should now be able to sufficiently hammer your application, and hammer it on a regular schedule so that you can spot performance problems as they are introduced.
For the last post in my JMeter series, I’ll demonstrate how to use JMeter and Python to replay Apache logs and measure the results. This is very useful for recreating production load, so that you can see how your code reacts to traffic that is even closer to real life.

