Tilting at Windmills
Like the brave but misguided Don Quixote we often charge after performance problems we think are monstrous,
but turn out to be just minor issues.

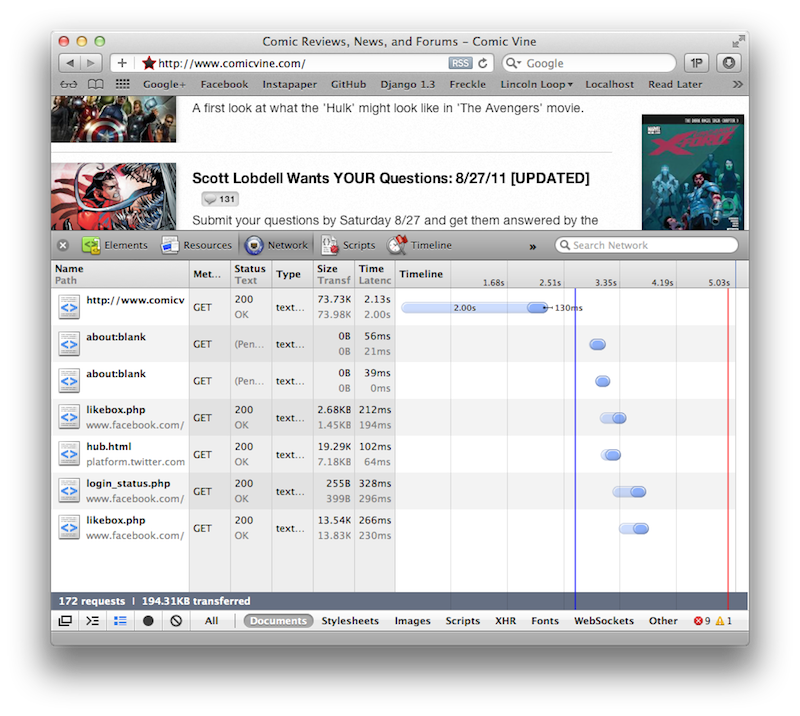
Response Time
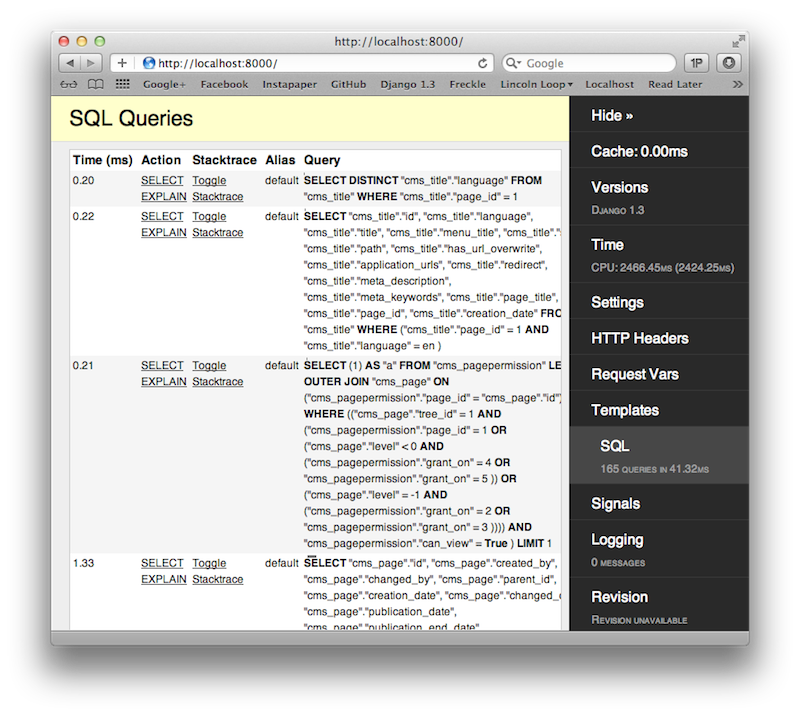
Django Debug Toolbar
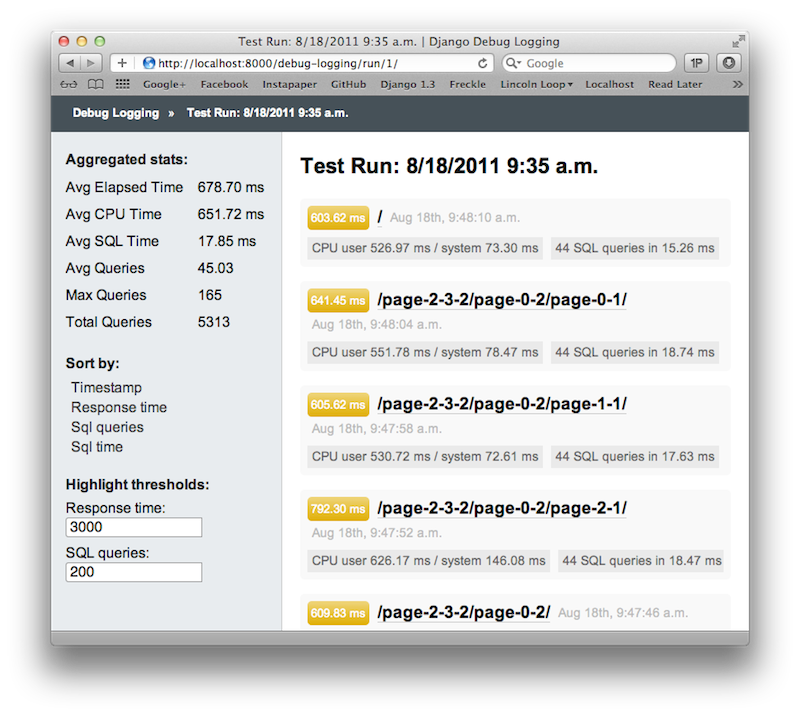
Django Debug Logging
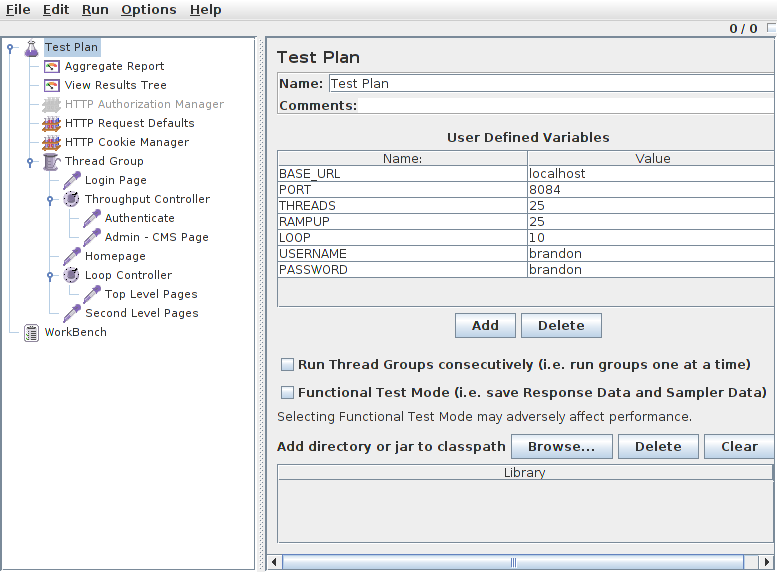
Jmeter UI
jmeter -p user.properties
Anatomy of a POST
Working around CSRF protection
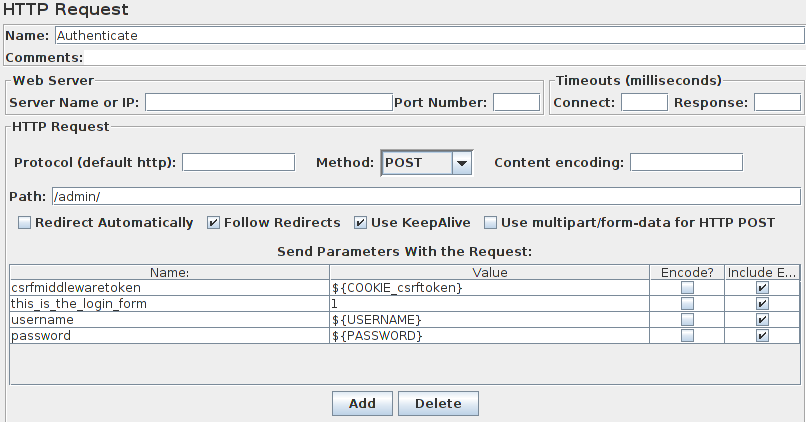
CSRF - This type of attack occurs when a malicious Web site contains a link, a form button or some javascript that is intended to perform some action on your Web site, using the credentials of a logged-in user who visits the malicious site in their browser.
Ground Kontrol
Lincoln Loop is hosting a private party for DjangoCon attendees at Ground Kontrol, from 9 to 11 pm Wednesday evening.